Welcome to my page on consumer products. We are inundated by the sheer number of products, not only in supermarkets but out in the online space, where there is merchandise for every need. I will try to cover as many of them. I choose my topics based either on whim or seasonal habits. But if you have other ideas for a topic, please write and let me know!
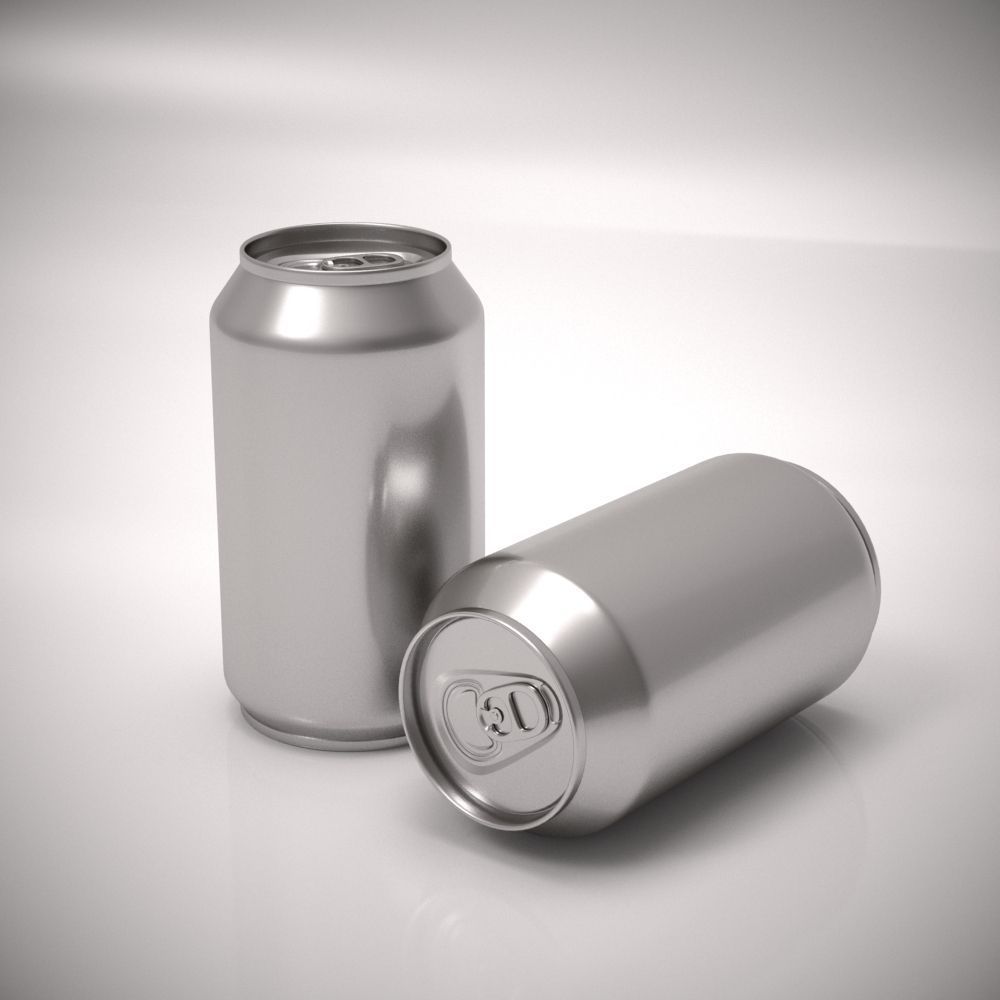
We all recognize these as containers holding our soda on a hot summer’s day, a beer (or two) after work, and even maybe the tonic companion to a gin cocktail. They’re a handy size to carry around, fit snuggly in our hand and the cupholders in our cars hold them nicely as well. Three 330ml volume cans give us one litre, about half of our daily recommended liquid intake (depending on whom you ask). But unlike plastic and glass bottles, we can’t reseal the can.
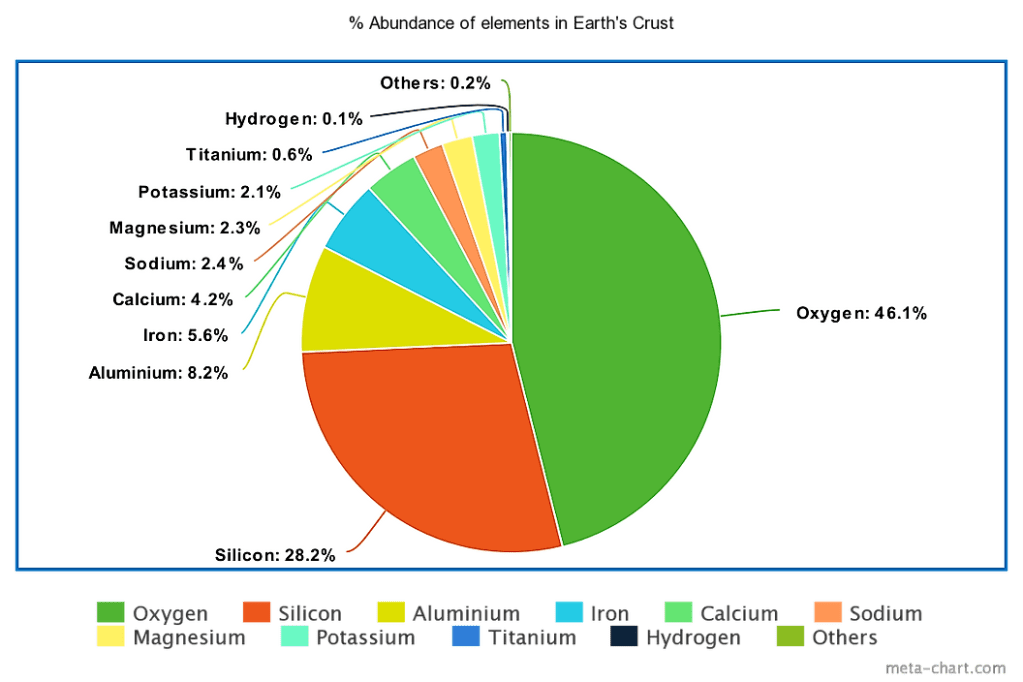
Back to the point. Aluminum cans are the largest single use of aluminum globally. Bauxite was initially discovered in 1821 in southern France and it wasn’t until 1887 when Karl Josef Bayer patented his process for extracting alumina, the alumnium oxide, from bauxite. A latiritic rock, bauxite is high in aluminium and rusty-red in colour. Not all laterites are bauxite: the iron-rich variety is extracted for construction. Given the ubiquity of aluminum soda cans – the sound of the popping of the can lid is unique and recognised worldwide, the inventory of a vending machine is almost 100% soda can, even in bound hay you’ll even find a flattened and colour-faded can, tossed in the field before harvest – it is not entirely surprising that aluminium is the most abundant metal in the earth’s crust.
In 1999, aluminum production accounted for 2% of the world’s energy use, while recycling soda cans uses only 5% of the energy needed to produce new aluminium. And good news for soda companies and soda fans, aluminium can be recycled again and again without losing quality.
Why recycle:
These single use containers are convenient but producing primary alumninium cans is extremely energy intensive.
Aluminium is already one of the materials with the highest recycling rate. More than 90% of aluminium used in the construction and automotive industry is recycled. The European Union’s Circular Aluminium Action Plan – a roadmap for EU policymakers and European aluminium industry to work together – aims to increase the recycling potential of aluminium to full capacity, saying this is “a strategy for achieving aluminum’s full potential for a circular economy by 2030.” In the graph below, four countries in Europe have already achieved recycling rates of over 95%.

Not only is aluminium recycling limited to beverage cans, but global aluminium scrap is highly sought after. Countries that consume large amounts of aluminium-containing goods don’t usually have the infrastructure and technology required to recycle and process aluminium scrap. In turn, these countries are also the largest exporters of aluminium scrap. No surprise then that the top five importers of aluminium scrap are also home to the world’s top automotive makers.
More on that later. But first, let’s start at the beginning.
Extracting Aluminium from Bauxite Ore
Bauxite ore is the world’s primary source of aluminium. And bauxite is most concentrated in tropical and sub-tropical regions across West Africa, the Caribbean, Australia, South America (Brazil, Jamaica, Venezuela, Suriname and Guyana), and India. In 2020 alone, around 150 million tonnes of bauxite was mined, with almost half this amount originating from Australia. Large blanket deposits are found in flat layers near the surface, over an area of many square kilometres. This layer thickness varies from less than a metre to 40 metres deep, though 4 to 6 metres is the average. Bauxite mining is polluting – below I have added two tables showing chemical and particulate pollutants originating from primary sourcing and from recycling. In the US, aluminium is processed using hydropower while in China it is done with coal powered-plants.
Before mining begins, the land must be cleared of all vegetation. This includes all timber and plants. The most serious and extensive mining impacts are degradation of land quality, land instability, water contamination, air pollution, climate change, as well as changes in topography and hydrogeological conditions.
Next is the removal of the top soil, which is usually stored for replacement during rehabilitation.
The layer under the top soil is known as the “overburden”. This layer may exist in some locations and be altogether buried in up to 20 metres of rock and clay. Overburden is on average 2 metres. Bauxite is a hard material and in order to loosen it up beneath the overburden, blasting, drilling and ripping by bulldozers is used. Once in manageable pieces, they are loaded onto trucks, railroad cars and transported to crushing and washing plants or to stockpiles before being shipped to alumina refineries which are usually in the vicinity.
Processing bauxite ore undergoes a relatively simple procedure for removing clay. This is known as beneficiation. It also reduces the amount of material transported and sorted.
Aluminium is not biodegradable but due to its highly reactive qualities, it will oxidise rapidly and will break down chemically in nature. If left in the desert, what will remain over the years is a white power. Its breakdown does not do any harm to the environment.
The Upstream
Land has economic, social, and ecological value. And the aim in mining should and ought always be a transient use, meaning that “after mining, the condition of the land should be restored so that its value is similar or greater than it was before disturbance.” Revegetation and land reclamation efforts may be implemented in order to restore the land after any damaging mining activities. But this really depends on how well topsoil reacts when placed above the bauxite mine spoils at specific depths and how much bauxite contamination is in the soil.
With the extraction of much bauxite, the soil is much less able to hold water, making the planting of a diverse range of crops infeasible. Tree crops and pasture are all but remain in Jamaica’s bauxite post-mined lands.
Mining pits are often interspersed with small rural communities. Post-mined land is not always restored. And if mining operations are not carried out appropriately or legally, spillover into other ecological systems such as waterways will occur. Apart from bauxite dust, caustic acid is released through spills and dumping, making their way to waterways, creeks and rivers, killing fish and other aquatic life. Bauxite dust, which is red in colour, covers crops and vegetation in Guinea which has the world’s largest bauxite reserve. Dust, as defined by the World Health Organization as particles in the size of 1 to 100 micrometers. Any smaller than 10 micrometers, and it poses a risk to human health: respiratory, cardiovascular. and pulmonary problems arise as the dust travels into lungs and the bloodstream. As mentioned above all stages of bauxite mining generate dust.
Before bauxite can become aluminium, it must be processed into alumina. Known as the Bayer Process, turning bauxite into alumina goes something like this:
After beneficiation, the ore goes through a process to remove any residual silica found in the bauxite. Silica is considered a contaminate that weakens the quality. Once all silica is removed, in a process called digestion, the remaining ore is combined with a hot caustic soda material in a heated pressure vessel. Depending on the composition of the bauxite, the ore is heated to 145°C (gibbsite) or 200° to 280°C (böhmite). The aim here is to dissolve the aluminium-bearing minerals to yield a sodium aluminate solution:
Al2O3 + 2 NaOH > 2 NaAlO2 + H2O
Once this occurs, the bauxite residue can be separated from the solution through a sedimentation process. The alumina can then crystalise through a precipitation process
Al(OH)4– + Na+ → Al(OH)3 + Na+ + OH–
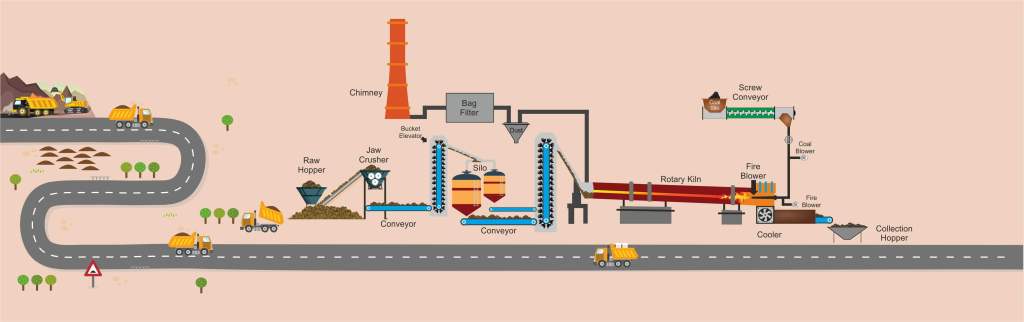
Coarse crystals are removed through classification and processed in a calciner or rotary kin to remove bound moisture and yield alumina in the following chemical reaction:
2Al(OH)3 → Al2O3 + 3H2O
A by-product and maybe the most challenging of the Bayer Process, is the red mud, or red sludge problem. Red mud, if uncontained is an environmental nightmare. Its high alkalinity poses a health hazard to people and is caustic to flora, fauna. For every ton of metallic aluminium produced, around two tons of red mud is also produced, and 30 million tons per year.
So we’ve talked about turning bauxite into alumina. As indicated, it’s not that easy. Turning alumina into aluminium is done via a smelting method called the Hall-Heroult Process. Here alumina is dissolved in a molten solvent called cryolite. An electrical current runs through the mixture, causing the carbon from the carbon anode to attach to the oxygen component in the alumina. Now we have aluminium and carbon dioxide
2 Al2O3 + 3 C > 4 Al + 3 CO2
One stage before the aluminium production phase is that of alumina – the white powder produced by crushing bauxite and washing it. In the US, bauxite is processed into alumina using natural gas.
This final step in turning bauxite into alumina involves calcination, which is a heating process to remove the chemically combined water from the alumina hydrate. The brick-lined calcining kiln is gas-fired and heated to a 1,100 C. The alumina rotates through it slowly then passing through a cooling mill. The alumina is transformed into a white powder, the final step of the Bayer Process, and ready to be shipped to aluminium smelters.
Although 90% of this material goes to towards the production of aluminium, alumina is used in many other industries thanks to its high thermal conductivity, hardness and abrasiveness. Dental impants, ceramics, and bone implants suggest a few. Nevertheless the Hall-Herault electrolysis process is highly energy intensive. carbon footprint for primary (non-recycled) aluminium is between less than 4 tons CO2 equivalents per ton aluminium in hydropower-based regions, and more than 20 tons CO2 equivalents per ton aluminium in coal-power based regions. The processing of recycled or secondary aluminium has a carbon footprint of about 0.5 tons CO2 per ton aluminium. An aluminium can using the same content of 27% primary ore sourced from China would be twice as carbon intensive in production than the average North American can.
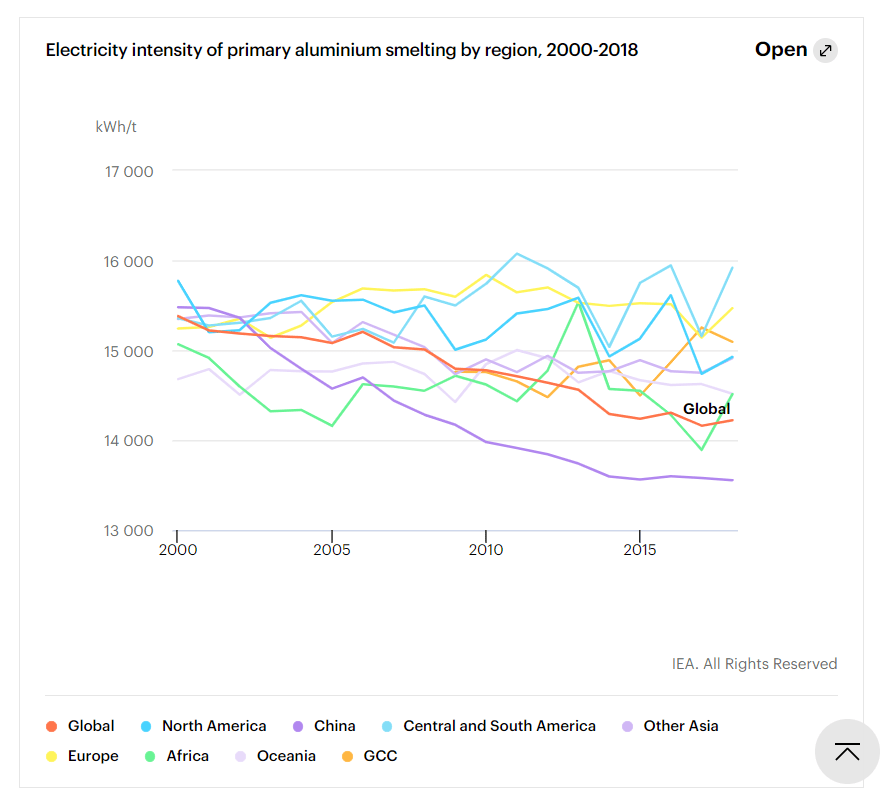
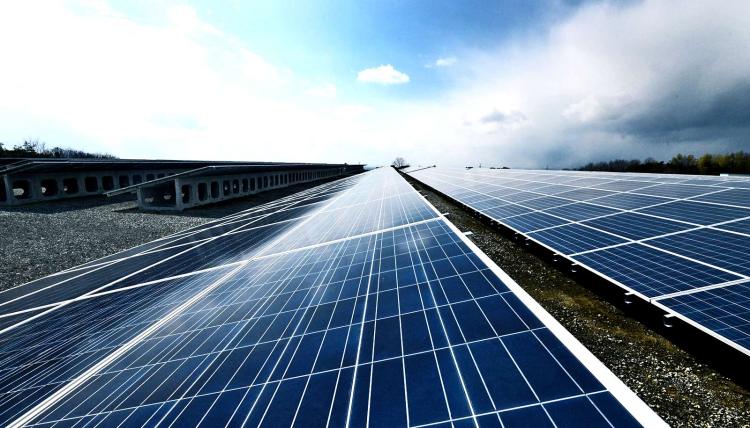
The production of aluminium from bauxite is a highly energy-intensive process, requiring high temperatures, fossil fuels and the release of pollutants. Much of the energy used is in the form of electricity. Global aluminium production is expected to rise in order to meet new demand for consumer goods as well as for goods to fulfill renewable energy demands, such as solar panels which also use aluminium. Solar panels will be covered in a later chapter.
Producing Aluminium Cans
As an element, aluminium is a silvery-white, lightweight metal. It is soft and malleable. Aluminium as a molten solvent is cast into ingots – the currency of the aluminium industry and the starting point for many products we rely on for every day use. In 2016, a 216 kg of primary aluminium ingot was procured to produce 1000 kg of rolling ingot with a can-specific recycled amount of 73%. As this process suggests, a massive amount of energy is required for heating and causing the chemical reaction to transform alumina into desired aluminium.
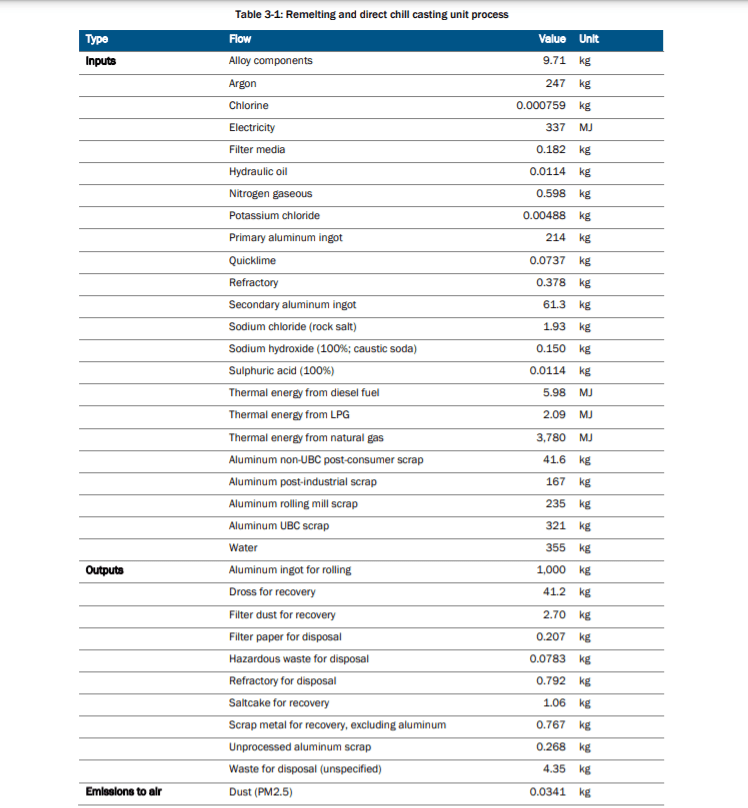
There are three stages to producing cans. The manufacturing of cans begins with the remelting and casting process. This is in essence a recycling process because it involves treated aluminium pre-consumer and post-consumer scrap that is mixed in with primary and recycled aluminium ingots. This mixture is compiled together and melted in furnaces before being cast into ingots for sheet rolling.
According to an Aluminium Association study in 2020, 49.6% of used beverage cans (UBC) end up in landfills against 50.4% that are recycled.
Can body stock and lid stock differ slightly. Both start in a hot mill rolling that pre-heats aluminium ingots of approximately .457 to .660 meters thick and weighing approximately 15 to 30 metric tons at around 540 C or 1000 F. This is then fed through to the reversing mill that rolls the sheets back and forth until the sheets are less than .00635 metres in thickness. This coil is then transported to the cold mill.
In order for cans to meet their industry standard for strength and durability, these sheets undergo a process called annealment. Annealing is a heat treatment process wherein an alloy is heated up to the prescribed annealment temperature for a period of time followed by controlled cooling. This softens the alloy and reduces brittleness. Temperatures range from 250 C and 450 C though not higher to prevent oxidation and grain growth.
At the cold mill, coils are continuously passed through rollers to reduce the gauge to 0.000305 metres. This is where sheets are cut to the dimensions prescribed by manufactures.
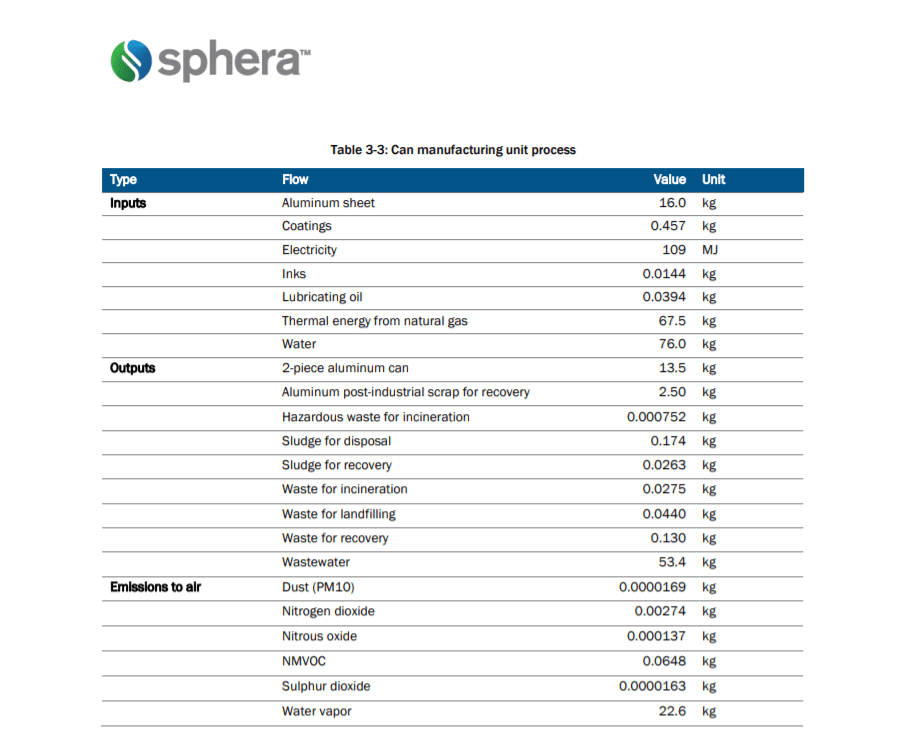
Stage two of the manufacturing process starts at the manufacturing plant. Here they are moulded into shape, formed and trimmed to the final dimensions prescribed by the manufacturer. This process does generate a lot of manufacturing (skeleton) scrap that is then shipped back to the recycling facility. Then they are painted and coated on the inside to establish a barrier between the beverage and the metal.
Alloys for can lids contain a higher level of magnesium that contribute to the stiffer quality of the lid material.
Lastly is the end-of-life process. UBCs are shredded to remove residual liquids and other contaminants before they are introduced to the furnace for smelting. These shreds are uniform in size to help the material flow in downstream processing. These shreds pass through magnets to remove ferrous contamination. Once they leave the shredders they pass into a decoating unit that heats the material to remove paints and coatings, which vaporize and oxidize. Primary aluminium metal is added to make up for system melt loss and improve the composition.
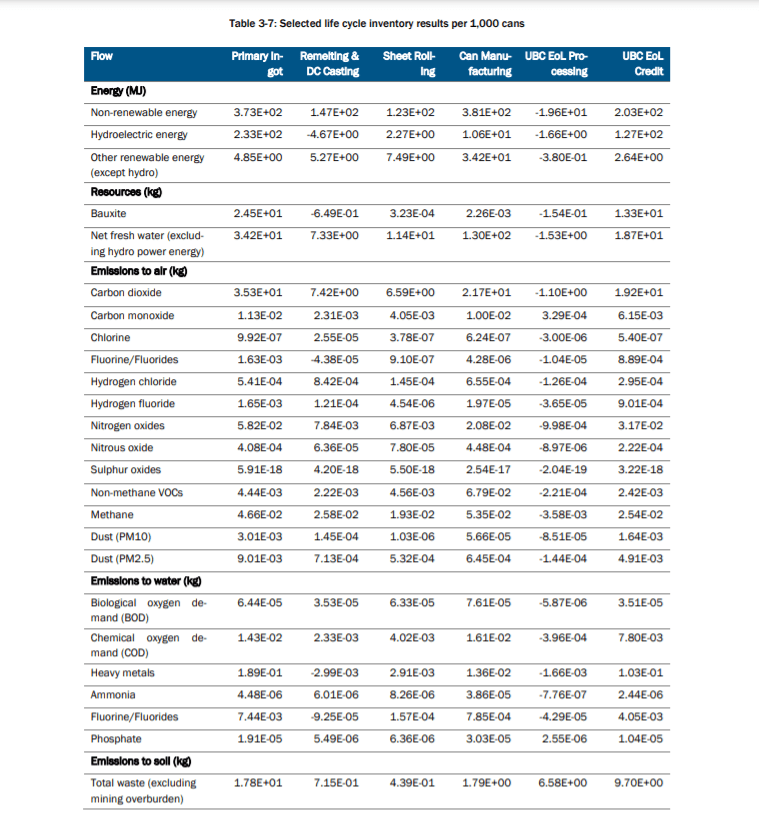
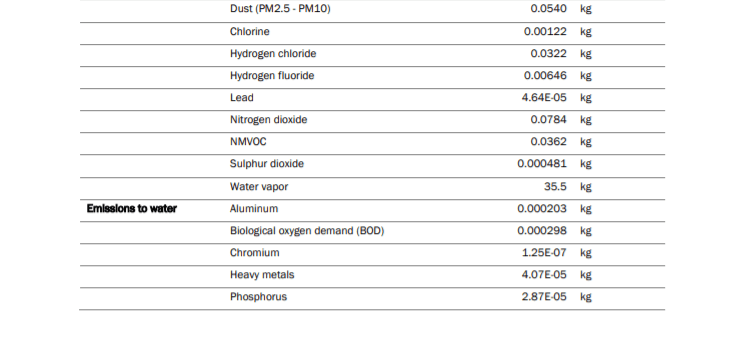
Throughout the remelting and casting process, there are numerous chemicals, particulates and thermal energy given off. The table below displays the amount in units of the chemicals, energy, feedstock, by-products in the production of 1,000 aluminium cans.
Power sector decarbonisation, such as the application of direct electrity use, the significant expansion of hydrogen, and biomass and renewable energies, is increasing. The goal is to be carbon neutral, increase the share of renewables in the extraction and development process and the corresponding reduction of fossil fuels.
(Slightly off topic, but while we are talking about alumnium and hydrogen, scientists have discovered that reacting aluminium with water will generate hydrogen without producing any greenhouse gases in the process. Normally, aluminium is coated with aluminium oxide so it does not readily react with water. But stripping it of this coating will produce hydrogen. Fundamentally, aluminium has great potential for storing hydrogen as long as there is water at hand.)
Corruption in the Bauxite Mining Industry
Sadly, like all extractive industries, the bauxite mining business is not exempt from corruption. Bribes by unlicenced mining companies to public officials in the mining ministries, customs officials, and various government agency authorities to gain back door entry into the mining sector pose environmental and social/health risks. For a bribe fee, state mining officials grant leases to mine laterite. But often many leases are granted to companies engaged in illegal bauxite mining.
In India’s East Godavari and Visakhapatnam regions, bauxite mining is restricted to the public sector and tribal cooperatives. In an effort to circumvent this, private mining companies colluded with state mining officials to produce false analyses of the soil to show that the material they were intending to mine was bauxite laterite. (According to the Indian Mining Bureau, any aluminium ore containing more than 30 percent aluminium is considered bauxite.)
A three-month ban on all bauxite mining operations in Malaysia was implemented after the country’s Anti-Corruption Commission found “elements of corruption” in the bauxite mining sector in 2015-2016. Several officials in the Land Office were under investigation for illegally selling export documents for the transport of bauxite to unlicensed miners.
Sustainable bauxite is vital for ensuring air pollution, water pollution and environmental damage is kept to a minimum. Some things common among unlicensed or illegal private miners is that they put little effort into reducing damage to land and waterways, rehabilitation and revegetation of the land mined.
Social and Health Consequences
A fascinating yet sobering study by the Human Rights Watch of the effects of bauxite mining on the livelihoods of local communities as a result of the extractive activities. Mining companies have benefitted from the Guinea government’s view that tribal lands are state owned, thereby limiting the amount of financial compensation mining companies are required to pay out to farmers who have lost land to mining, damage by the red dust coating their crops, damage to rivers and water sources. Mining provided 60 percent of the country’s export revenues in 2009 but only 20 percent of its taxes.
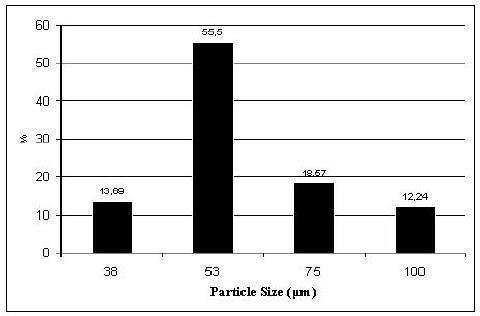
According to the Safety Date Sheet (SDS), bauxite is a Category 2 carcinogenic. If inhaled, the dust can cause a health hazard and the dust may cause redness to the eyes if exposed. The graph below shows a particle sample of bauxite dust. Half the sample size contained particulates of 55.5 micrometers.
Sustainable alternatives
Recycled sheet aluminium
Novelis, the world’s largest recycler of aluminium and based in Germany and supplier to automotive and aerospace industry, uses its high-tech plant to produce its ‘evercan’, a beverage container consisting of 90% recycled aluminium. The company recycles more than 74 billion aluminium cans a year. An aluminium can has an average lifespan of 60 days, so a can on the shelf today can be back on the shelf in a few months.
Biodegradable Soft Drink Can
A Taiwanese company Haoshi has taken on the seemingly intractable mission of developing a biodegradable soft drink can. If you can’t stop people discarding cans in nature, maybe biodegradability is another possibility? Ironically called Tin Can, these single use containers are made from Poly-Lactic Acid or PLA, and it’s not metallic, but a starch material extracted from corn.
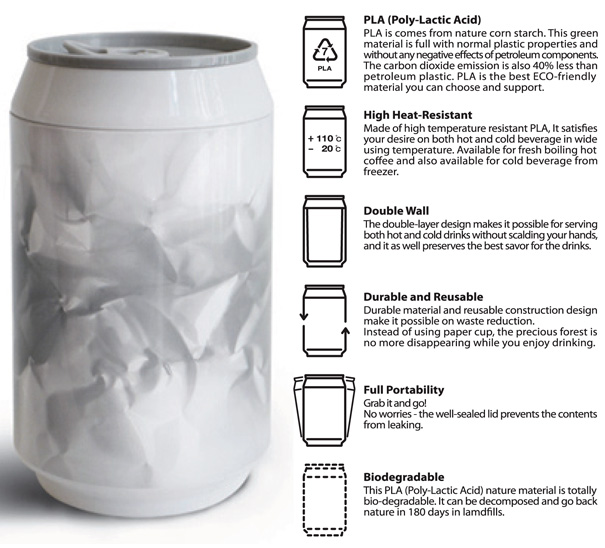
Surprisingly, PLA has the same properties as petroleum plastic, just without the negative effects – instead of lingering in nature and breaking down into millions of microplastic, this is biodegradable and compostable after 180 days, as opposed to petroleum plastics, in excess of 200 years. A reduced carbon footprint is the main argument for bioplastics like PLA.
Other material
Talking about soda cans wouldn’t be complete without the six-pack rings. However, these rings have been in the news for all the wrong reasons, and rightly so. Heartwrenching images of the rings strapped around turtles continue to flood the internet.
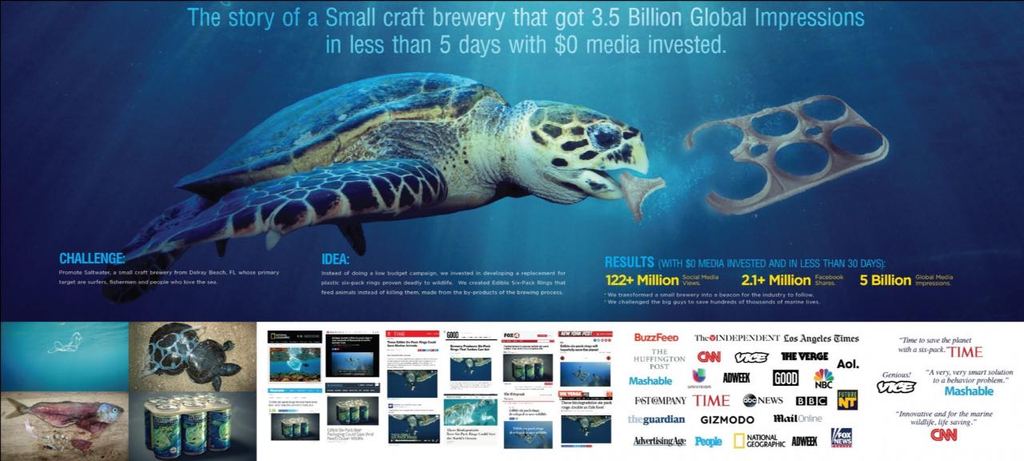
To combat the environmental hazard these rings pose to wildlife, Southwater Brewery took it upon themselves to create “100 percent biodegradable, compostable, and edible six-pack ring that is made from the barley and wheat remnants leftover from the brewing process.”
Conclusion
We cannot avoid aluminium in our lives – from our soda beverages to automotive parts – but we can reduce our disposal of aluminium and recycle more. Aluminium is not consumed but is used through multiple product cycles. Despite the fact that North American and Australian aluminium smelters employ hydropower to aluminium, it is still largely an energy-intensive procedure, requiring high temperatures and the release of dangerous greenhouse gases – such as carbon dioxide, methane, nitrous oxide, hydrofluorocarbons, perfluorocarbons, and sulfur hexafluoride – into the atmosphere. That many smelters in Western countries now use hydropower is already a positive change towards decarbonisation.
Aluminium is already one of the materials with the highest recycling rate. More than 90% of aluminium used in the construction and automotive industry is recycled. The European Union’s Circular Aluminium Action Plan – a roadmap for EU policymakers and European aluminium industry to work together – aims to increase the recycling potential of aluminium to full capacity, saying this is “a strategy for achieving aluminum’s full potential for a circular economy by 2030.”
Introduction
Solar panels have become mainstream as the most efficient and inexpensive source of energy. As we continue to innovate to harness the most energy, one thing is a constant: the Sun. Ever since the first application of a magnifying glass against the Sun’s rays to make fire, humans have come up with numerous ways to harness the power of solar energy. In 1767, Swiss scientist Horace de Saussure invented a solar collector, later used by Sir John Herschel to cook his food on his African expeditions. In 1816, the dish/Stirling system, a technology that concentrates the sun’s thermal energy to produce power was invented by Robert Stirling. William J. Bailey created the present design of solar power in 1908 – a solar collector with copper coils and an insulated box. And a year after photovoltaic technology was born in 1954, Western Electric sells commercial licenses for silicon photovoltaic (PV) technology. In 1983, worldwide PV production exceeds 21.3 megawatts with sales of more than $250 million. This is eclipsed by 1000 megawatts worldwide in 1999. Installation of the first grid-supported solar power system so fruition in 1983 in Kerman, California. Since then solar power has really taken off.
Amidst all the hype, questions and concerns have arisen around the environmental footprint of solar panel production. Yes, it is a cheaper system and this monetary incentive has been a huge encouragement in the development of technologies to harness solar energy. But only recently have solar panels become a mainstay for green energy, weaning us off fossil fuels, and rightly so. Solar far outshines electricity produced from fossil fuel sources: Per kilowatt, it offsets up to 376 kilograms of nitrogen oxides, 680 kilograms of sulfur dioxide, and 98430 kilograms of carbon dioxide per year. So pound for pound, solar panels, and other renewable technologies are the way of the future.
But their existence should not be taken as a given. How green are they, or, as others have asked before, how green is the process of their production? They are an invaluable part of our modern lives, just as aluminum is. But can their carbon footprint be reduced? And do the components and elements that go into solar panels play a role in fostering corruption and affecting human welfare negatively? In other words, what’s the environmental and social cost. I set to find out in this post what goes into the different types of solar panels.
Solar Panel Types and Composition
Two main types of solar technology exist today: photovoltaic (PV) and concentrating solar thermal power (CSP). Because the PV cell is the main form of almost all solar panels on the market, this post will only talk about PV cells.
Photovoltaic Cells or Semi-Conductor cells
A PV cell is a solar cell, composed of a semiconductor material. Semi, because its electrical conductivity is not as good as metal but better than an insulator. There are several different types of semi-conductors used on the market. We will cover them below. The efficiency of a PV cell is the amount of electrical power coming out of the cell compared to the energy from the light shining on it. This tells us how effective the cell is at converting one type of energy to another. Silicon is the most popular and most common material though there are other compounds that make up the remaining 5 percent of the market.
Physical properties of Si
Number 14 on the periodic table, silicon is the second most abundant element on earth, after oxygen, at 27.7%. This is good news for solar technology stakeholders. Being so abundant, the cost of silicon is inexpensive and represents over 95% of solar modules sold today. Silicon is used in three different types of cells: 1) monocrystalline, 2) polycrystalline, and 3) thin film.
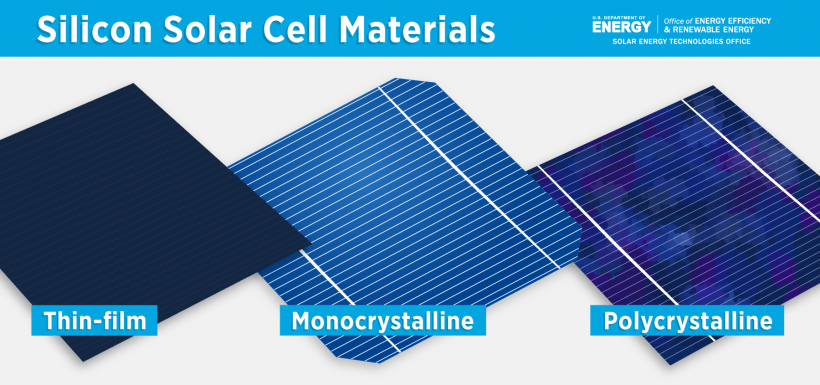
In mono and poly, the crystalline silicon, or c-Si, delivers efficiencies in the range of 15 to 25%. Because c-Si is ironically a poor absorber of light, these panels have to be very thick and rigid. Monocrystalline silicon is cut from a single high-purity crystal into wafers measuring 150 mm in diameter and 200 mm in thickness. These are a bit more effective at converting solar energy into other types of energy and are thus more expensive. They are also known to exceed their expected lifetime of 25 years. On the other hand, polycrystalline panels use many crystals layered together. Their construction is less expensive but they are not as good at converting solar energy to other forms of energy. They are also less durable and thus cheaper than their monocrystalline counterparts.
Unfortunately, material wastage is high in these first-generation solar panels.
Silicon, though abundant, does not occur uncombined in nature. Primarily, it occurs as an oxide and silicate. Oxides include sand, quartz, rock crystal, amethyst, agate, flint, and opal. Silicates include asbestos, granite, hornblende, feldspar, clay, and mica.
Thin Film Solar Cells
Thin-film solar cells use one of four PV materials: 1) amorphous silicon (a-Si) and thin-film silicon (TF-Si), 2) cadmium telluride (Cd-Te), 3) copper indium gallium diselenide (CIS or CIGS), and lastly, 4) dye-sensitized solar cell (DSC). These are an alternative to first-generation solar panels.
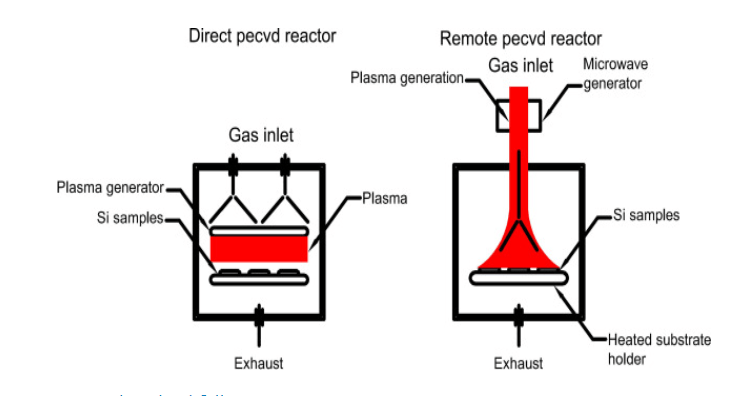
Thin-film solar cells are made by depositing one or more thin layers of PV material on a supporting material, which can be plastic, metal, or glass through a process called chemical vapor deposition. (This is a method to produce high-quality, high-performance, solid materials, typically under vacuum. In this process there is an actual chemical interaction between a mixture of gases and the materials used, thus forming a solid layer between the materials.) Thin-film are easier to manufacture, cheaper, and are ideal for smaller installations; that being said, they are less efficient than their crystalline counterparts, don’t last as long, and are more fragile.
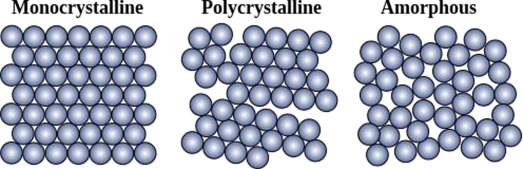
a-Si or thin-film silicon is a non-crystalline form of silicon that can be used in solar cells and thin-film transistors in liquid crystal display (LCD). Atoms form a continuous random network with numerous unconnected bonds, instead of forming a four-bonded tetrahedral structure.
Other Types of Solar Energy Technologies
Concentrated Solar Power, CSP
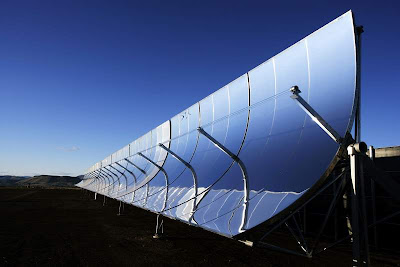
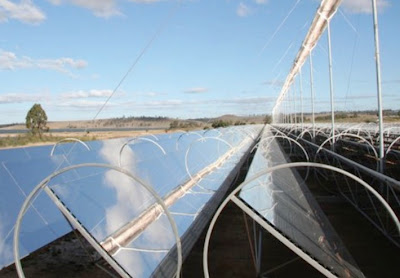
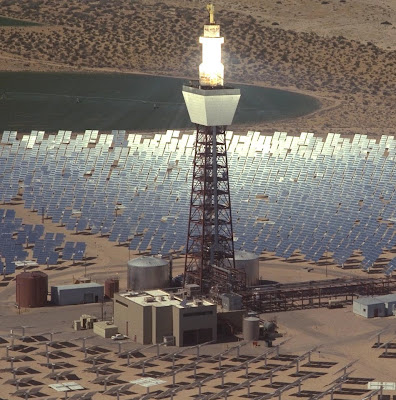
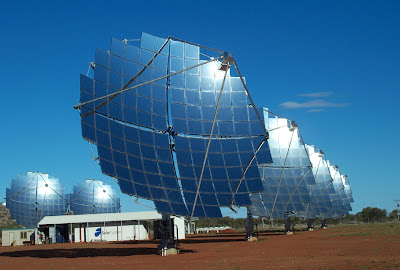
Unlike the photovoltaic semiconductors that convert light into electricity, concentrated solar power or CSP uses mirrors to reflect and concentrate sunlight onto receivers that collect solar energy and convert it into heat. This heat – otherwise known as thermal energy – can be used to spin a turbine or power an engine to generate electricity, or stored for later use as a gas, liquid, or even solid particles.
Several types of solar technology are found in CSP:
Parabolic Trough
Linear Fresnel Reflectors
Power Tower
Dish Engine
CSP is found primarily in utility-scale projects, such as water desalination, enhanced oil recovery, food processing, chemical production, and mineral processing. Because these are the only most cost-effective at the utility-scale, I have chosen to omit CSPs in this post so as not to confuse the environmental and social costs of both.
The Extraction Process
There is a lot of overlap between the a-Si and CdTe panels so splitting this post into different types of residential, small-scale solar technologies proved to be a bit of a logistical problem. This is a long post, and we are not even halfway! We still have extraction and production processes to cover, environmental and social costs, not to mention global trends in material recycling and solar panel waste management/material wastage.
Silicon, silica, silicates, and silicone
There are a lot of names being floated and the difference between them can be confusing: silica, silicon, silicates, and silicone.
Silica is what you mine in order to extract silicon, silica is basically the combination of silicon and oxygen. Out in nature, we recognize this as quartz, which is pure silica, without any contaminants like aluminum, calcium, potassium, and other minerals. (Even though quartz is considered to be pure silica, cultured quartz, or synthetic electronic-grade quartz, has been on the market supplying cellular phone companies. However, silicon is phasing out cultured quartz as a key ingredient in cellular phone technology.)
Silicon is a chemical element and one of the 97 natural building blocks from which our minerals are formed. A chemical element is a substance that can’t be subdivided into simple substances without splitting atoms. Because silicon is so abundant, miners have little trouble finding it. White sand, sandstone, and quartz are all types of silica: the combination of silicon and oxygen, namely silicon dioxide, SiO2. Pure silicon is hard to find because there is so much oxygen everywhere.
Silicates, like silica, are like the sand we find at the beach and the dust at a construction site. But silicates are what the geologists call feldspar, silica mixed with other minerals. Feldspars are silicates but they are not pure silica.
Now, silicone is a synthetic polymer of silicon, carbon, and oxygen and has a myriad of uses. It comes in liquid, solid, and gel form and is put to numerous medical uses. But is not found in nature.
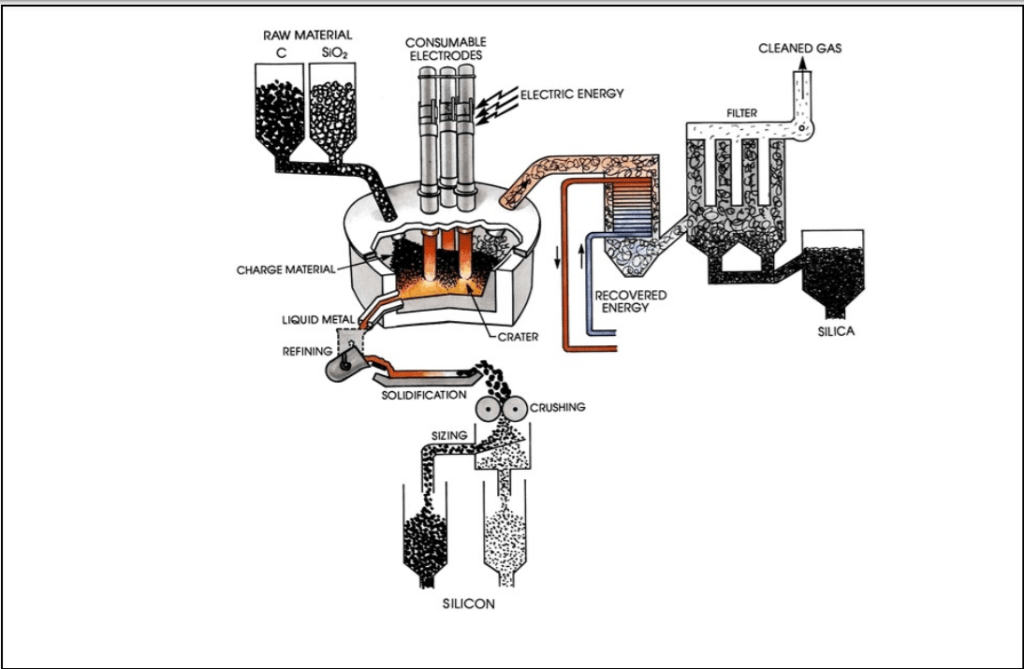
So now we know what it is we are mining, let’s talk about the extraction process, which is quite straightforward. Silica mining uses open pit or dredging mining methods with standard mining equipment. Once silica – here silicon dioxide – has been mined, the silica and quartz are entered into a furnace.
A typical industrial silicon furnace has a shell diameter of 10 meters. At 2000C the silicon dioxide is reduced to molten silicon. This process is known as the reduction of silicon dioxide by carbon (or chemically as the carbothermic reduction of silicon dioxide). The silicon is tapped through a tap-hole at the bottom of the furnace and refined by slag (then solidified under controlled conditions to yield high-purity silicon crystals) or gas purging (the process of an inert gas flowing into one part of the system and out of another part of the system to prevent explosive reactions from the mixture of gases with hydrogen). Once refined the molten alloy is allowed to cool in a mold then crushed to a specific size. Metallurgical-grade silicon is 98.5-99.5% pure silicon. Impurities can be carbon (C), boron (B), phosphorous (P) and other transition metals. Below is an image of a typical layout of a silicon furnace.
Metallurgical grade silicon is cheap to produce. Production of 1 million metric tons/year of silicon at a cost of a few US dollars per kg, depending on quality, impurities, and particle size.
Silicon: amorphous and crystalline
Amorphous silicon, or a-Si, is developed using the chemical vapor deposition or CVD method. Monocrystalline cells are produced from pseudo-square silicon wafers, substrates cut from boules grown by the Czochralski process, the float-zone technique, ribbon growth, or other emerging techniques.
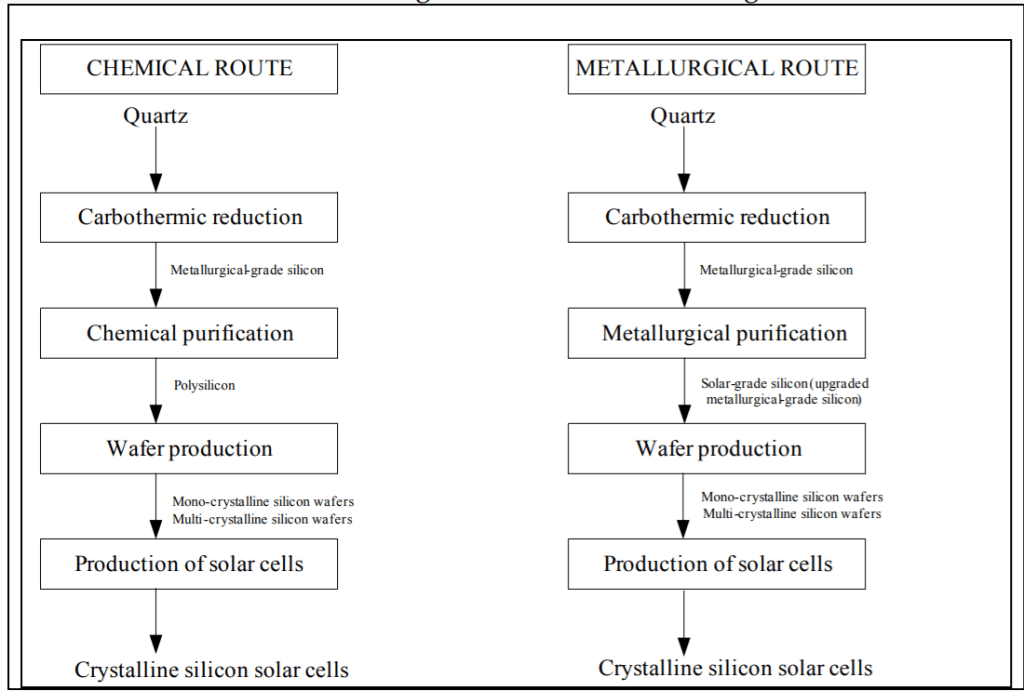
Crystalline silicon cells are produced by square silicon substrates cut from ingots cast in quartz crucibles. There are two methods of processing silicon for PV cells: the Siemens or chemical process implemented in the 1950s for the production of electronic-grade silicon; and the metallurgical route.
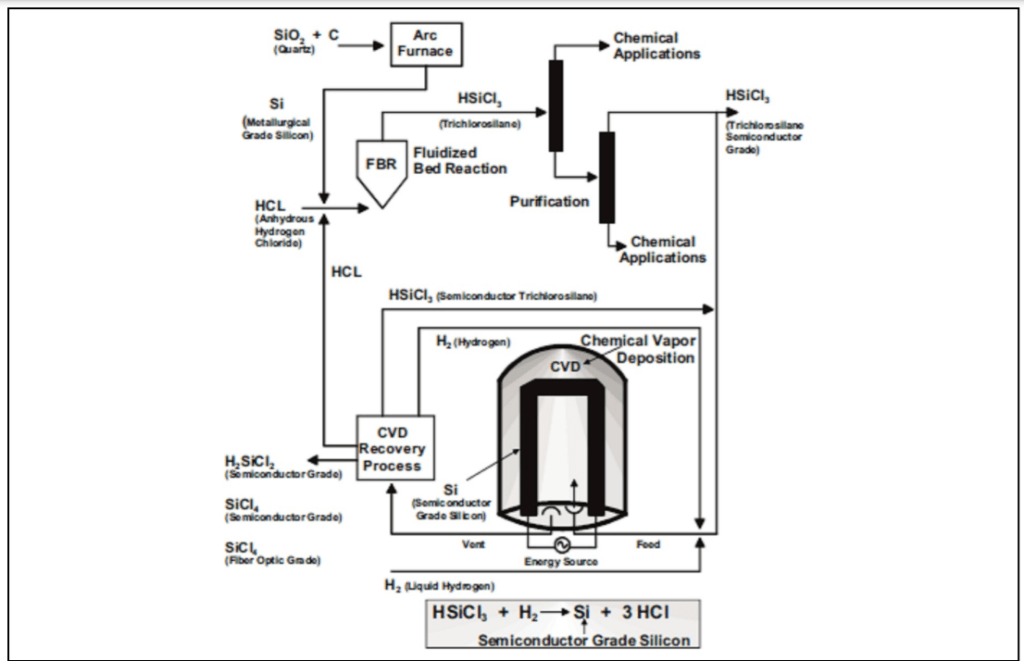
The Siemens or chemical route involves high-energy intensity procedures and the introduction of powerful and corrosive substances, such as chlorosilanes and hydrochloric acid. Nonetheless, this remains a favorite method in producing polysilicon (or the crystalline form of silicon, c-Si) to purity of 99.99999% for both the PV and electronic industries. Metallurgical methods produce mono-crystalline silicon wafers or amorphous silicon. This method uses the input of other high-purity raw materials such as purified quartz, carbon black, and high-purity electrodes.
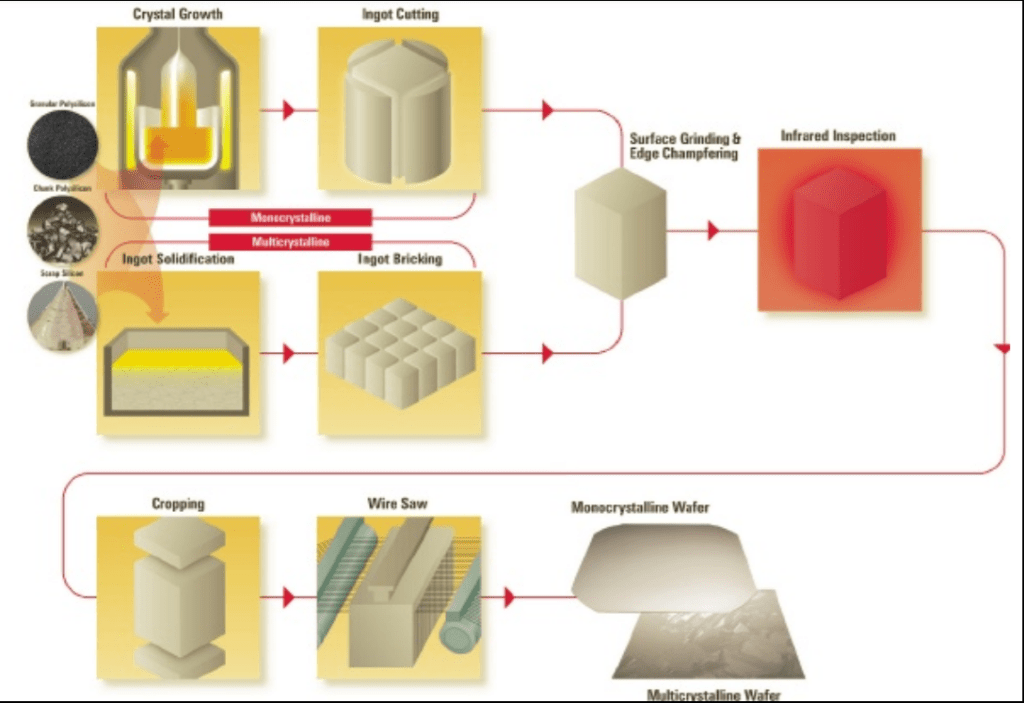
Here is an image of how c-Si wafer panels are produced.
External Costs of Silicon Production
Solar panels have been heralded as a new, innovative, and most importantly environmentally-conscious way of harvesting energy for heating and electricity. Their production and use have been encouraged by governments because they emit less CO2 than fossil fuels and by way of carbon credit (CC) in reducing CO2 into the environment. That said, the amount of CC earned is associated with the amount of solar electricity produced, which usually depends on climatic conditions of the area and also the efficiency of the cells along with other conditions. Hence, achieving a standardized CC for solar panel use is almost impossible unless the conditions are very local and parochial.
But the dark side is the amount of pollution and material waste that PV cells generate. A few studies have shown that large-scale solar panel production results in a high carbon footprint which even the benefits of solar energy cannot redeem. Other studies cite evidence of negative health and environmental impacts.
Silicon production increased by 240% from 2000 to 2019. There are three ways scientists determine emissions from primary material production. First is the direct process-related emissions. Second, come the emissions from auxiliary processes, and thirdly, the indirect emissions due to the production of the electrical energy used in the production process. As most of this production occurs in Asia, a concern that arises is how the high-energy and high-carbon fossil fuel energy processes from coal continue to dominate silicon generation.
Direct carbothermic processes are not as energy-demanding as the chemical equivalent, according to some literature, at ca. 4.7 to 5 tonnes of CO2 per kg of Si. But indirect metallurgical processes in the form of the heat emitted from this highly energy-intensive process is about 5.5 tonnes of CO2 per kg of Si, this comes from the electrical energy required to produce heat for the reactions in the furnace. The specific electrical consumption is 10.5 – 12 kWh/kg Si. Other indirect emissions that arise from auxiliaries, such as fans, baghouses, are put at around 1 kWh/kg Si. For the entire production process, carbon emissions start at zero for nuclear, geothermal, and hydro sources to 15-21 t CO2e/t Si for coal and natural gas.
In the furnace, CO gas reacts with oxygen in the air to form CO2 and there are inefficiencies in and losses in the process that contribute to increasing the carbon consumption per unit of metal produced. Impurities in the raw materials, such as wood chips and charcoal, burn to form CO2.
Below is a diagram showing the energy mix by geographic region in the production of metallurgical-grade silicon:
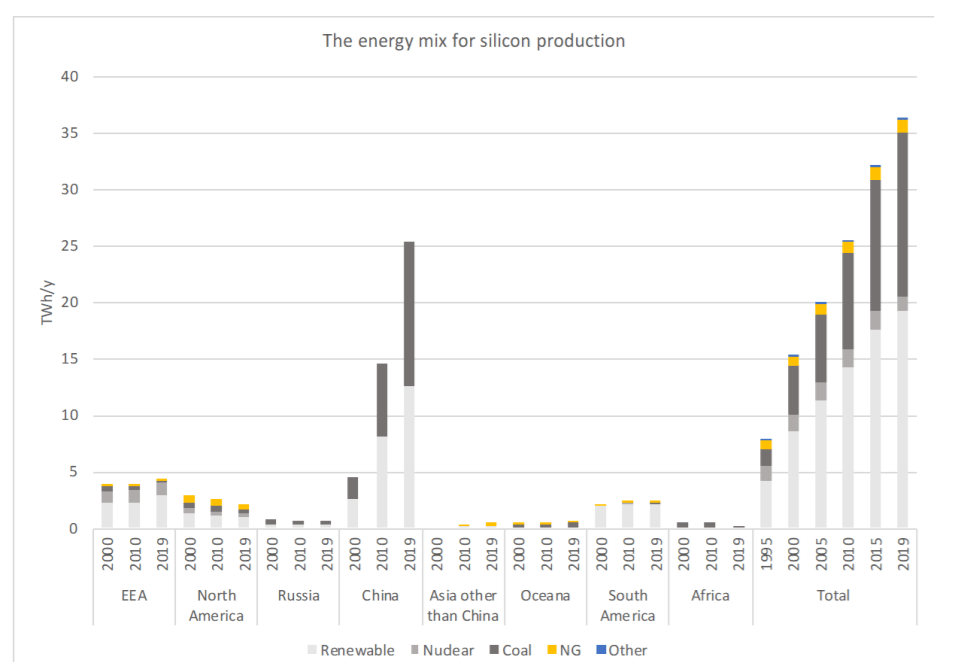
Since 1995, low energy and low carbon-emitting power sources like hydro, geothermal, and nuclear power have declined and fossil fuels such as coal and natural gas has filled the void, 40% and 3% respectively.
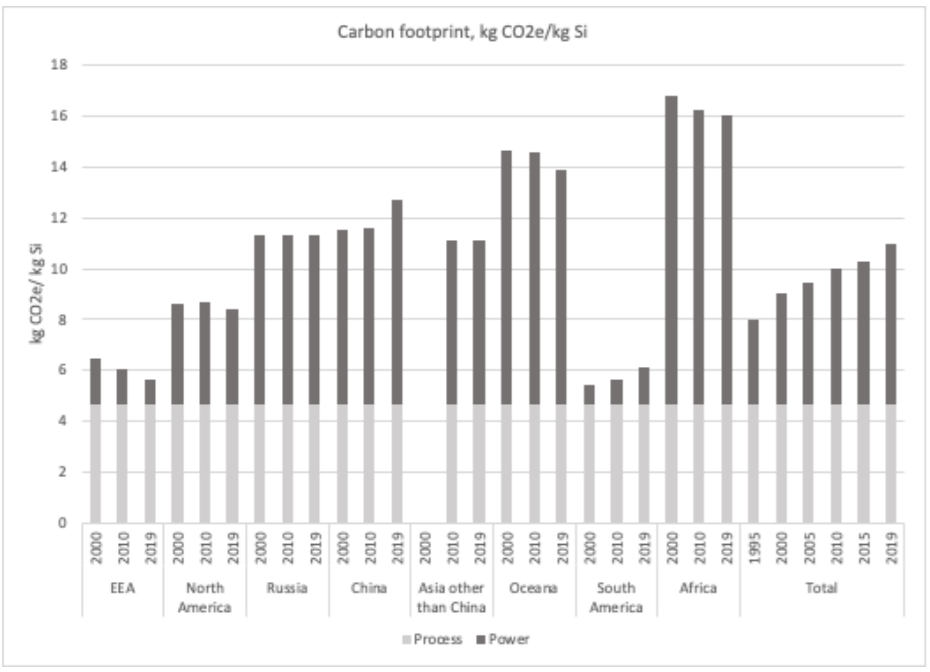
Unfortunately, low carbon energy sources do not deliver the sufficient energy required in a high energy intensity production chain. Historically, when Si production was lower, hydro and nuclear power were preferred energy sources, reliability and cost-effectiveness being the main arguments in favor. Silicon processing plants would locate themselves close to hydro and nuclear plants.
However, since 1995, less silicon was produced with hydropower and nuclear power and more with coal and natural gas. Another reason is the shift of production to China, which is responsible for 68% of global Silicon production. Since this period, nuclear power contributions have dropped from 14% to just 4%. And all in all, low carbon energy contributions have declined altogether by 71% to 57%. On the other hand, coal power has doubled its share by 20% to 40%. This has massive implications for silicon production in a world that regards PV cells as the answer to reducing carbon dioxide emissions.
It is truly a sad irony that a material we consider as one of the solutions to reducing CO2 emissions actually employs more fossil fuels now than it did 20 years ago when silicon was primarily used in the semiconductor industry. Yet as of 2006, the PV use of silicon has surpassed that of semiconductors.
Alternative Production Processes
Methane gas and hydrogen have been floated as some innovative alternatives and environmentally-conscious ways of processing silicon. However, both remain in the laboratory phase and industrial approval and application are yet unknown. Methane would certainly reduce CO2 emissions but not put a stop to them altogether. There is hope with hydrogen but silicon with good purity is elusive when hydrogen is used.
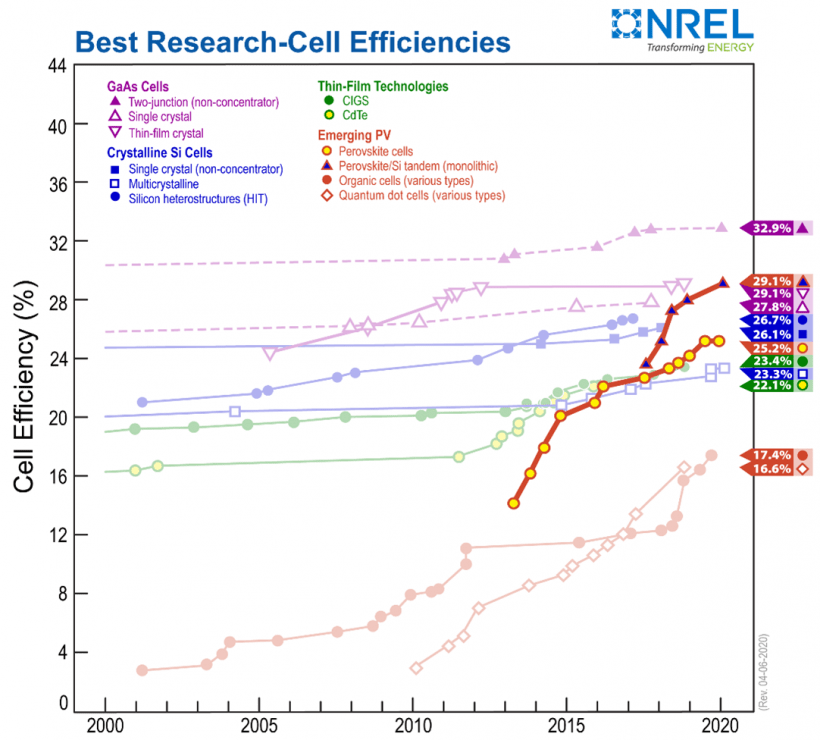
Another hopeful alternative is perovskite, which instead of silicon or other material, perovskite solar cells are made of metal crystals, usually, lead. China is already making some with the lead from recycled batteries. Production is a lot cheaper than that of silicon panels which means they are more cost-effective. The efficiency of perovskite panels was 3% in 2006 and has risen to 26% today. Below is a graph showing perovskite efficiency against mainstream solar panel materials.
Health Concerns
If CO2 emission for silicon production is what it is, it should not come as a surprise then that there are major health hazards involved. The main air pollutants of the silicon production process are SO2, NO x, CO, and particulate matter (PM), which are consequences of the combustion of coal and charcoal and the refinement of quartz sand; and the main water pollutants are SS Silicone (a category of synthetic silicone polymer that bonds to a variety of compounds), Chemical On Demand (or COD) (the amount of dissolved oxygen that must be present in water to oxidize chemical organic materials, like petroleum) and salt.
Normally released from diesel fumes and shipping vessels, what’s commonly known as NOx, nitrous oxide (NO or NO2) is formed in the furnace. A Norwegian study found that although the amount of NOx released into the atmosphere contributed to just 5% of total emissions in Norway in 2010, it did represent 40% of land-based industry.
A study on the health and agricultural damages as a direct result of exposure to silicon production in Southwest China estimated that the average external cost to be CNY 447.35 (CNY 321.1–473.82) per ton of metallurgical silicon, or CNY 27.29–48.76 million ($4.22 -7.5 million. Throughout the silicon production process, various substances and chemicals, sometimes noxious, are used: silicon tetrachloride, hydrochloric acid. Silicon tetrachloride turns into hydrogen chloride or hydrochloric acid (HCl) which is dangerous and toxic to animal and human life. Poor regulation of waste management in China has resulted in solar panel manufacturers disposing of these chemicals on land and rivers that nearby villages rely on. The case of the severely polluted Mujiaqiao River was one such example.
Recycling Silicon Solar Panels
Solar panels have an average lifespan of 20-30 years. Since panels were first introduced in 2000 many are reaching the end of their functional lives. Through a comprehensive process of demanufacturing, parts harvesting, recovery, and recycling, silicon can be effectively recycled. Items that use recycled silicon are refurbished solar panels and lithium-ion batteries.
Recycling regulations vary between the US, EU, and other regions. In the EU, regulations require 85% collection and 80% recycling of the materials used in PV panels, under the Waste Electrical and Electronic Equipment (WEEE) Directive, which was extended to solar products in 2012. EU-funded solar panel recycling non-profit organization, PV Cycle collected over 27,000 tons of solar panel material by the end of 2018 and at 94.7%, the real figures already exceed those required by law. Veolia, operating in the Bouches-du-Rhône region of France, gathers all components of a solar panel – aluminum, glass, plastic, copper, silver, and silicon – and sends them to separate recycling streams. In the EU, the cost of recycling is built into the purchasing price of the panels.
In the US, recycling rates are a different story. Recycling costs are high so production from primary material exceeds that of recycling. The US does not have a PV recycling policy, so a lot of panels end up in landfills, and the Cd-Te panels can leak lead and cadmium (heavy metals) into the land, irrigation, and water systems. By 2031, the Institute for Energy Research estimates that the volume of solar waste could surpass that of new installations, and by 2035, this figure could be as high as 2.56 times. Even though there is no overarching policy to recycle panel components, recycling comes from within the industry itself. First Solar, America’s largest solar panel company has facilities that can extract 90% of the materials in the panels. To date, Washington is the only state that mandates manufacturers to dispose of panels at a specialized facility.
SOLAR PANELS – CADMIUM TELLURIDE
The following are elements and compounds that represent the remainder of solar panels sold.
Cadmium Telluride, Cd-Te
Physical Properties of Cd and Te
Number 48 on the periodic table, Cadmium is a soft, silvery metal with a bluish tinge to its surface. Almost all cadmium is mined from zinc. Tellurium, at number 52, is a semi-metal obtained as a powder. Highly toxic and teratogenic (disturbs the development of an embryo or foetus), small quantities are already hazardous. Used mostly as an additive in alloys, especially in copper and stainless steel to improve their machinability. Recent uses include vulcanising rubber, tinting glass and ceramics, and solar cells. Tellurium is present in the earth’s crust at only about 0.001 parts per million and found in few minerals, such as calaverite, sylvanite and tellurite.
After c-Si, Cadmium Telluride is the second most common PV conductor in thin film solar panels, currently representing 5% of the world’s marketplace in solar cell technology. The highest efficiency rate was recorded at 22.1%, whereas average rates are around 18%. Still lower than c-Si. Benefits of Cd-Te cells are their high absorption rate and low cost manufacturing.
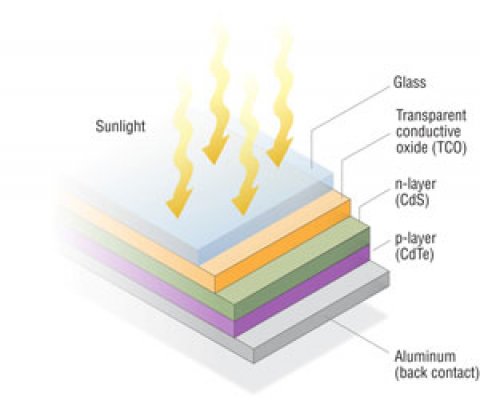
If we thought c-Si panels were thin, around 160–240 μm thick, compare with Cd-Te panels that are within 10 μm and still operate effectively. Produced by refining copper and smelting zinc ores, these are applied as a thin film layer to a pane of glass. There are a number of benefits for suppliers and consumers to use Cd-Te panels.
Benefits:
- Low cost manufacturing: Average costs are around $1 per watt but some scientists believe this could drop to as low as $0.5 per watt.
- Easy manufacturing process: Producing Cd-Te panels is easier than that of silicon because the electromagnetic field that makes turning solar power into consumable energy depends on two types of cadmium molecules.
- Compaitble with sunlight: Cd-Te’s performance in absorbing energy from the sun is almost the perfect wavelength (shorter wavelengths) when compared to a silison solar panel.
- Stable prices: Cadmium is abundant. It is a by-product of the production process of copper and zinc and other metals.
Disadvantages:
- Tellurium Supply: Tellurium is a rare earth metal, and in 2019, refinery production worldwide amounted to a mere 470 tonnes. (These figures are for tellurium mined in copper reserves only.)
- Lower efficiency: Even though laboratory tests report efficiency levels of over 22%, almost comparable to c-Si, outside of the controlled laboratory environment, realistic figures are closer to 10.6%.
- Cadmium is Toxic: A heavy metal, cadmium is one of the six most toxic elements in nature, and is both carcinogenic and teratogenic. Studies have shown that Cd-Te is less toxic than cadmium itself. However Cd-Te dust is a health hazard once inhaled, ingested or handled improperly.
Statistics of tellurium indicate that about 40% of tellurium ends up in solar panel technology; another 30% in thermoelectric production. Metallurgy receives 15% and rubber a mere 5%. All other applications receive 10%.
Copper Indium Diselenide (CIS) or Copper Gallium Diselenide (CGS)
Copper
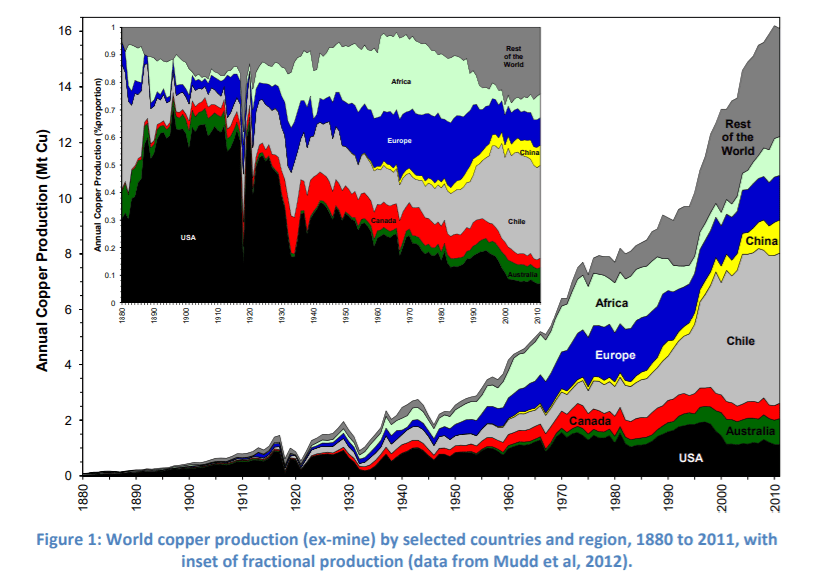
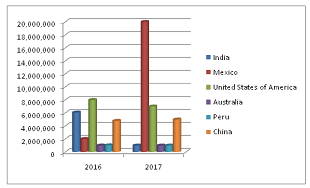
Copper at number 29 is a malleable, reddish-gold metal. Its malleability made it attractive to early humans, making it the first metal worked by humans. The discovery that it could be hardened with a little tin to form the alloy bronze gave the name to the Bronze Age. Occurring naturally, copper is found in the greatest amounts in chalcopyrite and bornite. Unlike cadmium, 1.2 milligrams of copper is necessary to sustain human life and help enzymes transfer energy to cells, but excess copper is toxic. Copper is priced at $4.73 per pound. Copper deposits contain about 2.1 billion tons of copper while undiscovered resources which the USGS estimates to be 3.5 billion tons. Latin America is the largest producer by far, accounting for 42% of all copper produced, followed by Asia at 17%, Europe and the USA following closely behind at 13% each, Africa at 10% and Oceania at 5%. Chile is the largest producer, followed by Peru and China. Global production of the conductive metal was at 19.1 million tons in 2017.
The mining process follows either one of two methods. Underground mining, which accounts for 10% of all copper mining methods is done by drilling a vertical shaft into the ground to reach the copper and subsequently driving horizontal tunnels in the ore to extract it.
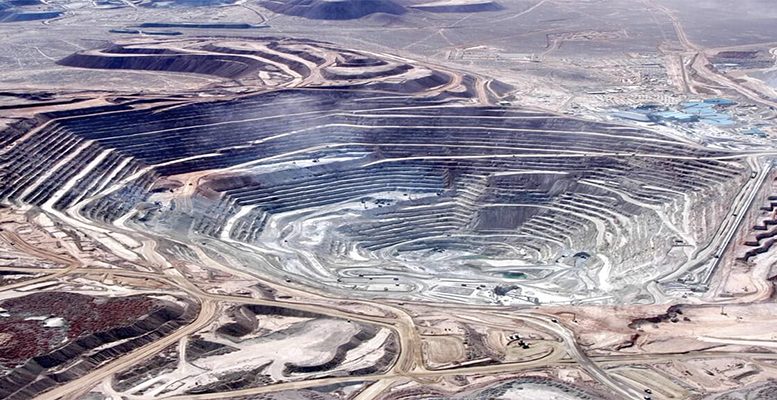
Open-pit or opencast mining represents 90% of all mining methods, in which a series of stepped benches are dug deeper and deeper into the earth over time. Boring machinery is used to extract the ore and explosives are employed to blast and break the rock.
Once mined and transported to the refinery from the site by trucks, there are two methods of extracting copper: one is hydrometallurgical for copper oxides and low-grade ores, and the other is pyrometallurgical for copper sulfides and high-grade oxides. The type of copper determines the method. Copper oxides are more abundant and near the surface, but lack quality and have a lower concentration of copper. Sulfides on the other hand are less abundant but contain more quantities of copper. Copper applications are diverse, covering sectors such as electrical engineering, automobiles, construction, machinery, shipbuilding, aircraft, precision instruments, watches and clocks.
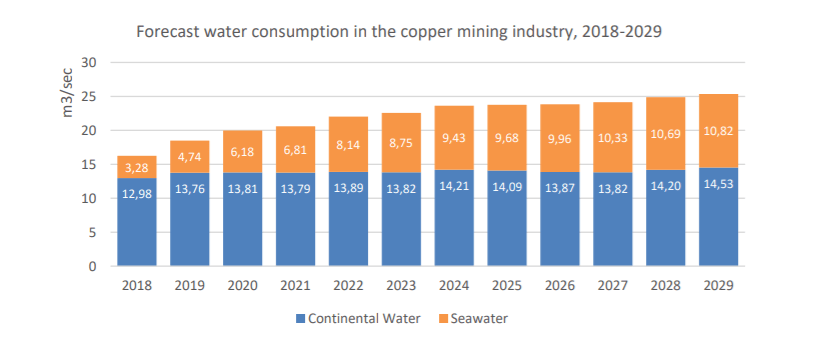
Controversies arise from the usage of water in the treatment of copper ore. Water volume is measured as acre-foot, which is 325,851 gallons, or 1,233,480 liters. Water comes from different sources. Seawater if the mine is near the coast. Though due to the impurities and high saline content, not all mines have the infrastructure to desalinize and de-oxygenize (eliminate aquatic life) seawater. Continental water, which is jargon for groundwater, freshwater, and surface water, are preferred sources thanks to low saline levels and move towards the sea but are less accessible and/or scarce. Think glaciers, rivers, lakes, run-offs, rainwater, and surface reservoirs. About 71% of our planet is covered by water. And of this 71%, 91% is salty seawater, and 3% freshwater. Nearly 2% of this freshwater is frozen at the poles and 1% is liquid freshwater. While seawater is abundant, continental water is scarce.
Effective water management systems are important in order to ensure fair allocation. Mine sites are usually located in places where water is already a scarce commodity. This is largely where the controversy arises. Local villages and towns rely on the same water sources as do copper mines. Take Chile, for example, the global supplier of copper. The Atacama desert, one of the driest places on earth, has experienced a decline in the water table. Not only is this a region rich in copper but also is a main site for mining lithium, which will be covered later. This has finally prompted Chilean environmental agencies to pay more scrutiny to copper mining operations in the region. According to the Chilean government’s study in water usage, 2018-2019, seawater usage is on the rise but nowhere near continental water usage. Despite the United Nation’s declaration that access to clean water is a human right, the majority of people around the world continue to be denied this basic right.
The same problems arise in Zambia, where four big mines dominate the industry. Copper mining generates enough to account for 65% of export earnings, but that comes at a steep price for locals who live near mining sites. Land degradation. Water depletion and pollution. Release of sulphuric dust and particles into the air. Damage to health and livelihoods. The ground had been contaminated and the crop yield dropped.
Over a 5-year period between 2004 and 2008, the Rosemont mine in Arizona used 5,000 acre-feet of water per year with a production of 220 million tons of copper. This gives 7.4 gallons per pound of copper, or 28 liters per 0.45 kilograms, which is at the low end. Some mines have facilities to recycle their water. But given the high usage of continental water, mines with recycling facilities are minuscule. Continental water is expressed in units as m3 per ton of raw material produced.
Copper mines are some of the largest in the world because the ore that is mined contains only 1% copper. An area of 60,000 acres like that of the Morenci mine property is at the upper end. One ton of ore contains approximately six to 10 kilograms of copper. Although less abundant, copper sulfides have higher copper content and are easily separated from rock and unwanted minerals. Copper sulfides are extracted from the ore using the pyrometallurgical method, or the pregnant leach treatment. Whether it is a copper oxide or copper sulfide that is mined depends on the country they are extracted from. In the US, copper sulfide is mined. In Chile, copper oxide is mined. Copper oxide benefits from lower capital and operating costs. Copper sulfide quantities are diminishing.
Pyrometallurgical treatment applies high temperatures to cause and speed up chemical reactions that are impossible at low temperatures. The high temperatures also cause spontaneous reactions that help heat the mineral to a liquid, thus aiding in the separation of mineral from ore and other unwanted material. Pyrometallurgical recovery has four steps, and depending on the type of sulfide copper, some steps can be omitted.
Roasting: Once the ore is extracted from the mine site, it undergoes roasting in smelting ovens to prepare the mineral for either pyro or hydrometallurgical processing. In pyro treatments, it dries, heats, and partially removes the contaminants such as arsenic to produce a calcine ready for smelting. Ore is heated to about 650C or 1200F, eliminating 20 to 50 per cent of the sulfur as sulfur dioxide.
Smelting: concentrates or calcines are melted to form a copper-rich matte liquid. Heat is supplied by gas or oil and furnace temperature can exceed 1500C or 2730F. Sulphur dioxide is released from the furnace. The heat to melt the concentrate comes from three energy sources: retained heat from roasting, external energy sources from fossil fuels or electricity, and the heat from the chemical combination of iron sulfides and oxygen.
Conversion: The goal of conversion is white molten copper or Cu2S. The remaining sulphur in the white metal is then oxidized to SO2 leaving blister copper. Blister copper is metallic copper of a black blistered surface, being the product of converting copper matte and being about 98.5 to 99.5 per cent pure — called also Bessemer copper.
Fire refining: Blister copper is further purified to make it suitable for electrorefining. Excess sulphur is once again removed through blowing it out in the form of SO2. Continuous smelting is something we hear more and more. It is the next step in copper refining where all four steps are in one facility. This helps reduce operation costs, energy costs as energy from one phase can be used in the subsequent phases and helps decrease materials used.
Hydrometallurgical methods use water-based or acqueous solutions and apply only to copper oxide and low-grade oxide and sulfide ores. Passing oxides through a milling treatment like the pyrometallurgical would not be economical as the cost of copper oxides is low. In the hydro method, roasting converts sulfide minerals to more leachable oxides and sulfates. Heat comes from either the oxidation of sulphur and external fuel. Here is a USGS link to the copper smelters around the world. There are quite a lot in Europe so if you are interested you can check out copperalliance.eu.
Leaching: One word you will see a lot in the hydro process is ‘leach’ and ‘leaching’. Leaching refers to when acids are introduced to copper-bearing ore, seeping through and dissolving copper and any other metals. The liquid that “leaches” through the rocks is collected. This liquid contains the dissolved copper, known as a pregnant leach solution (PLS). The copper present in this liquid is collected and later processed. Sulphuric, hydrochloric and nitric acid, as well as the ammonia are usually used as the leaching agents in a various copper ore leaching process.
Solvent extraction: This is the second step and involves two immiscible (unmixible) liquids are stirred together, causing the copper to move from one to the other. The pregnant leach is mixed vigorously with a solvent and the copper migrates from the leach to the solvent. The liquids are separated based on solubility and the copper remains with the solvent, the impurities with the leach solution. The remaining is recycled and put through the same process to win more copper.
Electrowinning: The last step is where an electrical current is passed through an inert anode (positive electrode) and through the copper from the previous step, which acts as an electrolyte. Positively charged cations or copper ions come out of the solution and are plated onto a cathode (negative electrode) as 99.99% pure copper.
Greenhouse gases
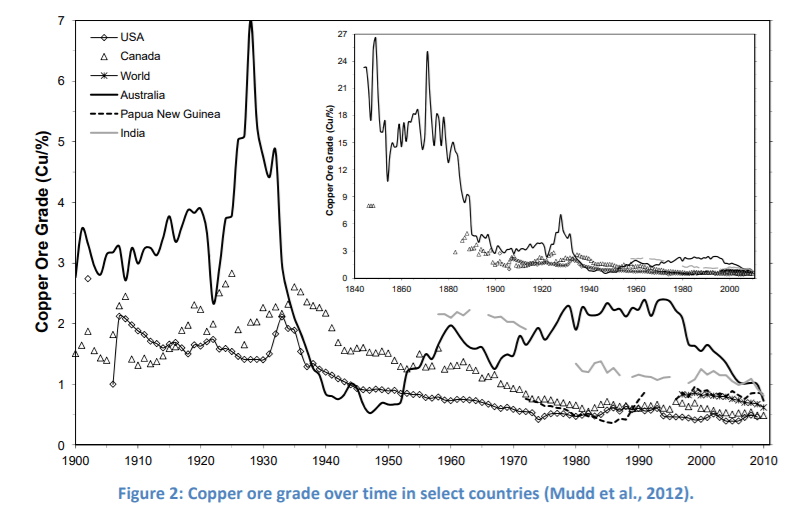
So you wonder, with all these processes involving gases, acids, intense heat, and acre-feet of water, what is copper mining’s contribution to global warming? There are numerous greenhouse gases (GHG) emitted in mining copper. Indirect GHG, from the mine site vehicles, transportation from the mine to the refinery, all emit GHG from electricity and diesel fuel. And the breakdown of ore to copper also emits carbon and sulfur dioxide. Direct greenhouse gases emitted from copper mining in Chile amounted to more than six million metric tons of CO2 in 2018, up from 5.98 million tons from the previous year. An article in the academic journal Nature estimated that “greenhouse gas emissions associated with primary mineral and metal production was equivalent to approximately 10% of the total global energy-related greenhouse gas emissions in 2018”. The worse the quality of the ore, the higher the fuel and electricity consumption. The graph below shows how copper percentage in the ore is on the decline since the 1950s.
As clean energy becomes the mantra of political campaigns, corporate marketing, and lifestyle changes, there is increased demand for electricity as the main source of energy to power industry, companies, and homes. This means increases in the demand for conductive metals like copper. A recent study five years ago estimated that copper demand will rise between 275 and 350% by 2050. But improvements in technological innovation and switching to electricity and moving away from fossil fuels to fire up copper smelters has drastically reduced the carbon dioxide emissions in the copper mining sector by 60% between 1990 and 2020.
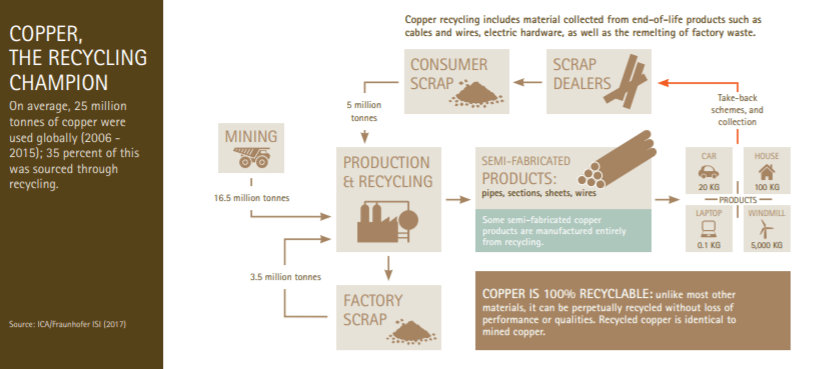
Recycling
Like aluminum, copper can be recycled repeatedly without any loss in quality. And like aluminum, recycling copper requires 80-90% less energy than primary production. It is estimated that since 1900, two-thirds of the 550 million tons of copper produced are still in use today. Around 8.5 million tons of copper are recycled every year. This fills the demands of power generation and transmission (45%), electrical equipment (12.5%), transport sector (12.5%), plumbing, roofing, and cladding (20%), and the remaining 10% is used in jewelry, cookware, coins, sculptures, and musical instruments.
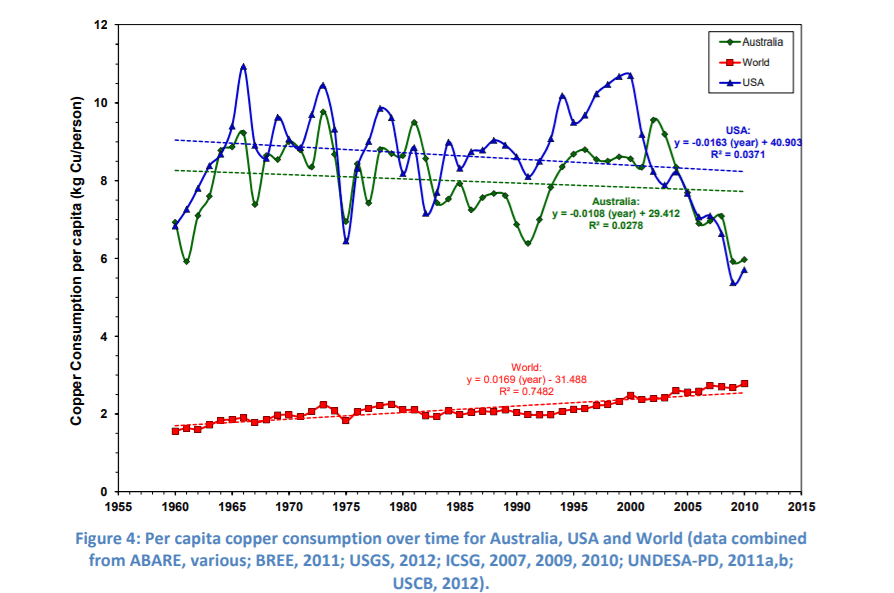
Despite rising prices and inferior quality of ore, copper consumption per capita continues to rise.
The authors of Future Greenhouse Gas Emissions from Copper Mining: Assessing Clean Energy Scenarios posit that global copper production will peak in 2044. By then recycling and improving efficiency will not only be a choice, but will be a necessity.
Indium
A silvery, soft metal that is stable in both air and water, Indium, at number 49, is mostly usually alloyed with tin and oxygen to make indium tin oxide (ITO) which is an excellent conductor of electricity, bonds well to glass and is transparent. Indium metal sticks to glass and can be used to give a mirror finish to windows of tall buildings, and as a protective film on welders’ goggles. In fact, we need indium to browse the internet. Formula 1 vehicles all have their ball bearings coated with indium due to their low friction. However, despite these many commercial uses, just a few milligrams of indium are highly toxic if ingested and are teratogenic. Indium is one of the least abundant minerals on Earth. It has been found uncombined in nature, but typically it is found associated with zinc minerals and iron, lead, and copper ores. It is commercially produced as a by-product of zinc refining. A kilogram of indium costs $4,300 (as of 24 Nov 2021).
Indium is highly dependent on zinc mining. Zinc has a wide array of usages, and the majority is found in galvanizing steel. The next most common usage for zinc is the combination with copper (to form brass) and with other metals to form materials that are used in automobiles, electrical components, and household fixtures. A third significant use for zinc is in zinc oxide (the most important zinc chemical by production volume), which is used in rubber manufacturing and as a protective skin ointment. And it is also found in vitamins and is essential for the proper growth and development of human, animal, and plant health. The amount of indium cannot be increased because it is dependent on zinc mining, but at the same time our demand for solar panels, LCD and touch screens is on the rise. 70% of indium today is used in thin-film products like our solar panels.
Pure indium doesn’t exist. Typically, it is found in sphalerite, a zinc ore, as well as ores of copper, tin and lead. Mining for zinc is very similar to that of copper, however, most zinc is mined through underground tunnels (~80%) and open-pit (~20%). Zinc is only roasted, i.e., zinc undergoes only the pyrometallurgical treatment at 950C causing zinc, copper and iron oxidation. Once zinc is reduced to powder form, the particles are leached with diluted sulphuric acid and the solution neutralised and contaminants removed. Indium is harvested using one of three methods.
Traditional method of recovering Indium
The traditional method is not different from the hydrometallurgical treatment of copper. Once indium-bearing waste products are collected after zinc mining, they enter a leaching process with a number of chemicals. This is a continuous process until all contaminants and impurities are filtred out. The electrowinning treatment is applied as a final step.
Because this post is about indium, I won’t delve into the mechanics of zinc mining. That will come at a later date when I talk about the galvanizing of steel.
Lead Sulphuric Slimes:
This process focuses heavily on the leaching method to filter out impurities. No more than three different stages of leaching are involved. Sulphuric acid leaches indium from lead waste. Then sodium hydroxide neutralises the filtrate and results in the formation of indium hydroxide. Indium hydroxide is leached with sodium hydroxide to remove contaminants and impurities. Finally, indium is extracted by leaching with sulfuric acid again.
Recovery from Crude Lead
This is also known as the Harris method. Water is used to leach impurities from the soda scum. Sulphuric acid is also applied to leach indium from the soda scum. Hydrochloric acid is applied to dissolve the indium.
Both processes use electro-refining.
The Extraction Process
About 15,000 tons of indium reserves existed in 2015, with more than two-thirds in China. Indium’s concentration in Earth’s crust is around 0.05 and 0.072 parts per million (ppm). In 2019, total world production of zinc was 13.49 million and indium from zinc concentrate was 760 tons. So per ton of zinc produces 0.000056338028169 tons of indium. Studies have shown that the metal depletion of CIGS technology is high, combined with 12-13% more land use in the extraction of the necessary raw materials. Here metal depletion means not only that a great deal of metal ores and rare earth elements are mined but also that they are not recycled. CIGS panels effectively end up in landfills once their lifespan comes to an end. Some recycling processes have been developed but are still in prototypical stages and none are in effect to date.
Currently, indium from LCD and other semiconductor usage is recycled but because of the complexity of the CIGS compound, indium in CIGS are not recycled. Or, recycling knowhow is in its infancy. Nevertheless, today, 480 tons of indium are produced annually from mining and a further 650 tons from recycling. In Japan alone, around 300 tons per year (tpy) are recycled annually.
Indium consumption grew at an increasing rate from 1990 to 2007 thanks to increased demand for indium tin oxide or ITO which is the key ingredient in coating glass as in thin-film panels. Indium production peaked at just over 600 tons in 2007, falling back to 520 tons in 2009. The global recession in 2009 hit the market badly. As of 2009, China accounted for half of global production.
Selenium
Diselenide is a compound containing two molecules of selenium and combined with an element or radical (also called free radical, is a molecule that contains at least one unpaired electron). Selenium, Se, at number 34 is a semi-metal that can exist in two forms: as a silvery metal or as a red powder. Used mostly as an additive to glass to decolorize glass or reduce the transmission of sunlight in architectural glass, given it a bronze sheen. Selenium is also used as a pigment to dye ceramics, paints, and plastics. Selenium’s recent uses include photovoltaic action and also as a photoconductive action (electrical resistance decreases with increased illumination). Therefore it is useful in solar cells, photocells, and photocopiers. Selenium is also used as an additive to make stainless steel. Every human body contains 14 milligrams of selenium; too little can cause health problems and too much can be carcinogenic.
Extraction from Copper
Selenium is produced from the electrolysis in copper refining. We have covered the mining and treatment process of copper earlier and selenium is extracted in the final phase, from the “anode mud”. Anode mud or slime is essentially a type of deposit that is insoluble in nature. During electrolysis, two plates are set opposite each other, an anode and a cathode, both are subject to an electrical current. Pure metal ions on the anode move towards the cathode, whereas impurities dissolve and are collected on the bottom of the beaker as anode mud or slime.
Pollution from Se Mining
Open-pit mining and surface mining are characteristic of coal mining but as one can quickly conclude, coal mining is highly polluting. Coal that has a high ferrous content is a popular source for Se because this contains between 5 and 300 times more Se than in other rocks. Both methods produce large amounts of waste rock known as overburden.
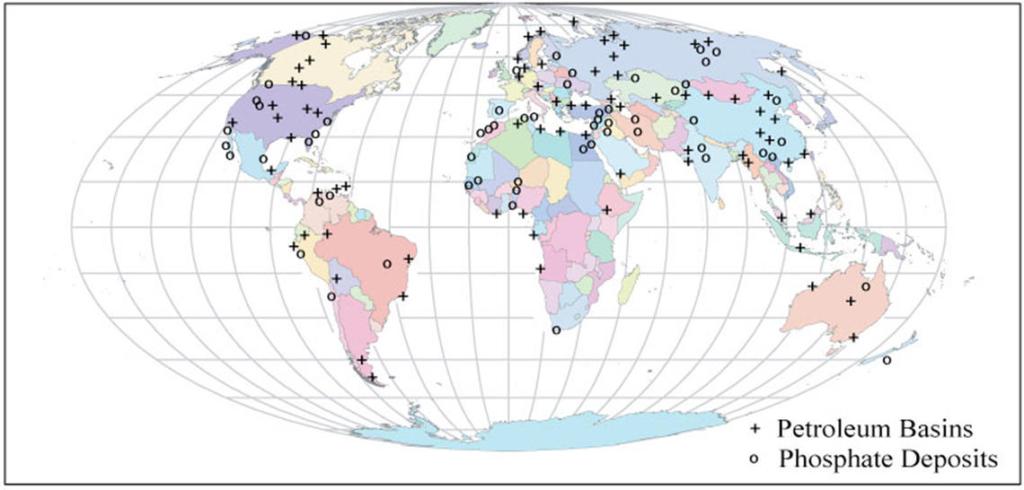
Selenium Poisoing in Phosphate Deposits
The rise in demand for selenium has resulted in increased interest in the element, not only from an investment point of view but also from a mining perspective. Selenium have been found in phospate deposits. Mining activities have released selenium into nearby environments, poisoning animals both wild and domestic. See below.
Selenium is also found in wastewaters as a pollutant. Selenium is a potentially toxic element due to its bioaccumulative potential or biopersistance. This means that it remains in the body for an indefinite amount of time after exposure. About 40% of selenium is released into the atmosphere and waterways through industrial activities.
Symptoms of selenium poisoing include:
- respiratory illnesses: mucous membrane irritation, coughing, garlicky breath odor, bronchitis, bronchial pneumonia, reduced respiratory rate, and ultimately, pulmonary edema and death;
- gastrointestinal symptoms: stomach upset, nausea, vomiting, diarrhea, a bitter metallic taste with burping and intestinal cramps;
- Hair, nail, teeth, and skin changes: brittle hair, hair loss, deformed nails, brittle nails, sloughing off of nails, tooth discoloration, tooth decay and mottled or discolored skin;
- Neurological changes: fatigue, irritability, listlessness, reduced mental alertness, emotional instability, hand tremors, tingling or loss of sensation in the arms or legs, reduced blood pressure and ultimately, unconsciousness and death.
Gallium
Gallium is number 31 on the periodic table and, similar to aluminum, is a soft, silvery-white metal. Produced as a by-product in zinc refining, gallium is non-toxic. The compound gallium arsenide (GaAs) is similar in structure to silicon and therefore a useful substitute to silicon in the solar cell industry. It is also used in red LEDs (light diodes) because of its ability to convert electricity to light. Solar panels on the Mars Exploration Rover contained gallium arsenide.
Gallium nitride, or a gallium compound containing nitrogen molecules, is also a semiconductor. We find it in Blu-ray technology, mobile phones, blue and green LEDs, and pressure sensors for touch switches.
Gallium has a high boiling point, which makes it ideal for recording temperatures that would vaporize a thermometer. It is present in trace amounts in the minerals diaspore, sphalerite, germanite, bauxite, and coal. Like cadmium and indium, gallium is mainly produced as a by-product of zinc refining. The price of gallium is $200-$400 per kilogram.
CIS/CGS technology
With efficiency rates comparable to c-Si panels at over 22.5%, CIS/CGS is growing fast in popularity but still lags behind the production and sales of Cd-Te panels. As of 2017, about 92% of solar panels were made from Si, followed by 5% CdTe, 2% CIGS and 0.1% a-Si. The downside of CIGS is the price of indium.
Carbon dioxide data for Indium, Gallium, and Selenium do not exist because they are not mined directly.
Gallium Arsenide (GaAs) Solar Panels
Gallium arsenide or GaAs solar panels created waves in the industry thanks to their high-efficiency rate of 27%. Gallium has already been covered above so I will talk about arsenide. You may recognize this word from another word that is a favorite in poisons, arsenic. Number 33 on the periodic table, arsenic is a semi-metal and in the metal form it is brittle, silver-grey, and bright. Although a small amount is found in nature in its natural state, arsenic is commonly extracted from metals and minerals. Most arsenic however is extracted from the copper and lead refining process. Its melting point is 1503 F (817 C). Uses include preserving wood, making special glass. The discovery of arsenic is attributed to Albertus Magnus in the 1200s. The average cost of arsenic is $3.20 per gram. China remains the top exporter and producer of the element.
I mentioned earlier that copper is thought to peak in 2044. If this is true, the future of many other elements, such as arsenide, selenium, and thallium, to name just a few, would be in peril. Recycling copper does not undergo the same processes responsible for by-products. But more on that later.
Arsenopyrite is the most arsenic-abundant mineral found in earth’s crust, making arsenic the 20th most abundant element. Its chemical composition consists of FeAsS. Found in small quantities that can often be overlooked, arsenopyrite has diverse uses, ranging from insecticides, herbicides, pesticides, and chemical weapons. Arsenopyrite dust is harmful and fumes, when heated, are toxic. Even the handling of this with bare hands is not advised. As much as 46% of arsenopyrite by weight is arsenic.
Arsenopyrite forms in hydrothermal veins – fissures in existing rocks that fill with new minerals. Arsenopyrite forms in massive and granular form, usually with other sulfide materials such as chalcopyrite, pyrite and other minerals. Arsenopyrite is unstable, even groundwater can dissolve arsenic materials, making groundwater harmful and not potable. However, a minuscule 0.00001% is necessary for the healthy development and growth of animals and humans.
Extracting Arsenic
Environmental Impact
Arsenic is collecting during the roasting of the
Very little arsenic is recycled, and the small amount that is comes entirely from scrap of GaAs panels.
Intermission: Rare Earth Elements
The mineral intensity of the clean energy transition is one that is often overlooked in policy, media, and other outlets. But there is no doubt that the carbon footprint from clean energies is a fraction of that of fossil fuels, at six percent of oil, coal, and natural gas.
TYRES
If you drive a car, or ride a bike or bicycle, you’ll appreciate the importance of having good tyres. We take them for granted sometimes, but they do need to be maintained. As anything that goes on a vehicle, be it two-wheeled or 18-wheeled, tyres need to be monitored for damage: bulges, punctures, cuts, and exposed wiring are all problems that can have huge implications if not dealt with early on. Some cars have what’s called TPMS, literally tyre pressure monitoring system. A specialised valve imports data to the vehicle’s computer unit and warnings are displayed on the dashboard. Not all makes have this capability. So manual checking of tyre pressure is still a must on many makes and models. Thus knowledge about the workings of a tyre is imperative…unfortunately, reading this blog won’t help you.
If you live in the northern hemisphere, you may have encountered the tedious deed of changing the tyres on your vehicle: summer tyres for warmer weather and winter tyres for colder climates. And if this is too much hassle, there are all-weather tyres. It’s pretty straight forward but you need to know the deadline for switching to winter tyres (in Germany you can be fined for driving on summer tyres after 1 November) and some countries prohibit the use of all-weather tyres in winter (again, in Germany, you get fined). This makes sense – safety, right? In summer, there are no prohibitions for driving on winter tyres. There are technical arguments for not driving on winter tyres in warmer climates. Something to do with the density of the rubber and how displacement is not favourable to the driving experience.
Anyways, this isn’t a blog on tyre problems or tyre pressure, not even summer or winter or even all-weather tyres.
How are tyres made?
Demand for electric vehicles has exploded. Tesla leads the way with almost a million vehicles sold, Volkswagen has about half as many electric vehicles on the road and Toyota’s Prius has become a household name since its inception in 1997. But with all these developments in the exhaust dimension, cars still require rubber tires to make our journeys comfortable and enjoyable, while reducing damage to our asphalt roads.
According to Dunlop, Continental, and Michelin, the production of tires involves 5 steps and 4 primary ingredients: rubber, steel, textile elements, and chemicals. As is tradition on this blog, let’s first go through the process of extraction, manufacturing, and procuring the required materials and then inquire into how they are all put together to produce tyres for sale in the market.
Rubber
Natural Rubber
There are two types of rubber: natural and synthetic. As with many other materals, the natural product is often complemented, or replaced, by the newer synthetic versions. Cost of production, supply predicaments, improvements in technology and other reasons have pushed upstream production away from natural raw materials and towards laboratory-designed synthetic materials. Rubber, both natural and synthetic, is sourced because a) natural rubber helps reduce internal heat generation while offering extremely high mechanical resistance, such that natural rubber is seen in mostly truck and earthmover tires, and b) synthetic rubber provides rolling resistance, longevity, and high grip capabilities. Car tires constist of 40 percent natural rubber while synthetic rubber makes up 60 percent of a tire.
According to the Industrial Rubber Goods, about a quarter of all the rubber in the world has natural origins. Natural rubber is sourced from the sap of several South American, African, and South Asian plants: the Brazilian rubber tree (Hevea brasiliensis), which is cultivated in the Indo-China region as well as Equatorial Africa, the Guyanese rubber tree (Hevea guyanensis) and the Mexican og Panama rubber tree (Castilla Elastica); and in India, the Indian rubber tree (Ficus elastica), the Funtumia elastica of West Africa and the Langdolphia owariensis located in the Congo basin; and, lastly, from Russia the Russian rubber tree, which is being outphased by the Russian dandelion (Toraxacum kok-Saghyz). Hevea brasiliensis remains the most commonly processed species.
The extraction of rubber occurs on plantations situated on or around the equator because rubber plants grow only in 25-30 celcius heat and require at least 5-6 hours of sunshine minimum.
The tapping of rubber trees produces a sap known in industry jargon as latex. Trees can grow up to 20 or 30 meters high and produce latex at the age of 6 or 7 years. For an area of 1 hectare, if on levelled land, there can be 500 pits, one tree per pit. Each pit measures 120cm x 45cm x 60cm. And on a slope, with a 2 meter wide terrace, there can be 450 pits. Pits on slopes are somewhat smaller at 75cm x 75cm x 75cm. From 6 -7 years of age onwards, the latex yield increases year by year, making this area a popular destination for investment. In young trees, the yield is 300-450 kg per hectar per year, while in budded plants, the yield can be as high as 800-1000 kg per hectar for the same period. Each year, until the trees reach the age of 12, trees have to be removed or replanted, so plantations begin with a high number of pits which are gradually reduced to around 300 pits per hectar. Plantations vary between 20,000 acres to 40,000 acres in size, so it’s clear that the yield in both rubber and investment can be worth it.
Collecting the sap requires the cutting of the bark at a shallow depth, basically peeling away a thin strip of the bark. One flow takes around 6 hours, after which the tapping ends for a specific period of time.
Natural rubber in the form of tree latex is essentially a polymer made from isoprene – a common volatile organic compound found in almost all living things, but abundant in certain plants as a metabolite (a substance formed in or necessary for metabolism). Isoprene’s role as a monomer of natural rubber makes it a highly popular and necessary compound for industrial uses. Monomers (mono = one, mer = part) are single molecules that combine other molecules to form complex molecules called polymers (poly = many). When stable, isoprene occurs as a colourless and odourless liquid. If heated, isoprene will polymerize, meaning the material will form a polymer.
Synthetic rubber
If you’ve ever held a lighter and wondered where that flame came from, that’s naphtha, a highly flammable liquid. As with many other products, synthetic rubber begins as naphtha, a compound produced as a by-product from the refinement process of hydrocarbons. Naphtha is then combined with natural gases to produce polymers. This initial process requires considerably more hydrocarbon energy than that of natural rubber.
Mixing Process
Once the appropriate proportions of natural and synthetic rubber are in place, it is mixed into a Banbury mixer together with as many as ten ingredients to produce the rubber we recognise as tyres. These ten ingredients are
- Antioxidants protect materials from oxidation during high-temperature processing
- Antiozonants prevent ozone degradation in rubber polymers because the double bonds in unsaturated polymers readily react with ozone (unsaturated polymers are double-bonds capable of further polymerisation; saturated polymers are bound to four other atoms)
- Calcium carbonate as a solidifying agent
- A reinforcing and colouring agent in the production of rubber tyres, carbon black occurs as a fine black fluffy particle as the oxidization of hydrocarbons at high temperatures.
- Cobalt is used to improve adhesion between steel and rubber
- Curing agents improve polymerisation
- Elastomers lend outstanding resistance to ozone, aging and weathering.
- Magnesium oxide is a heat-resistant solidifying agent
- Sulfur reinforcing agents prevent summer stickiness and winter brittleness (process also known as vulcanisation)
- Zinc oxide serves as an “activator” to stabilise the soft, sticky rubbery and improve the weight-bearing qualities
Tyre manufacturing would not be possible without the Banbury mixer. Invented in 1916 by Fernley H Banbury, the mixer has seen a number of refinements but overall, the design and function remain the same. The mixer churns the above ingredients into a homogenous mass which is then formed into slabs of rubber. These slabs then go on to the next process, known as calendering:
We now delve into the extractive process of the above-mentioned materials and the subsequent environmental and associated social costs thereof as pertains to these ingredients.
